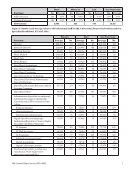
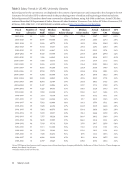
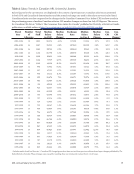
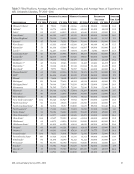
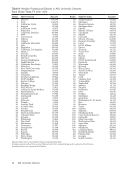
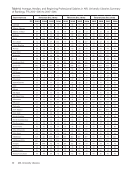
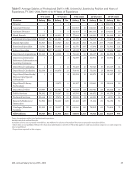
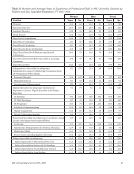
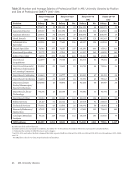
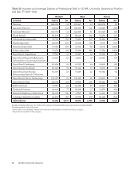
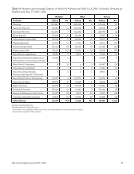
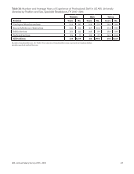
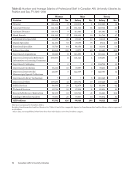
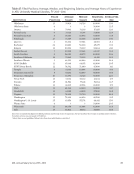
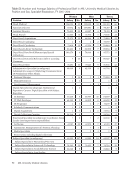
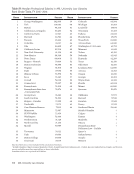
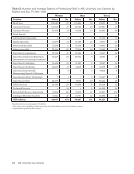
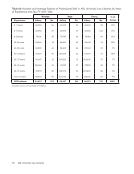
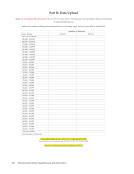
83 ARL Annual Salary Survey 2015–2016 Table 47: Filled Positions Average, Median, and Beginning Salaries and Average Years of Experience in ARL University Medical Libraries, FY 2015–2016 Institution Filled Positions Average Salary Median Salary Beginning Salary Average Yrs. Exp. Oklahoma 15 59,018 54,728 40,000 15.0 Oklahoma State 4 ‡ ‡ 38,000 22.5 Ottawa 6 79,963 76,103 57,455 12.0 Pennsylvania 9 77,726 77,714 51,000 22.4 Pennsylvania State 8 65,683 66,492 53,000 13.5 Pittsburgh 27 73,389 68,308 45,000 19.0 Queen`s 6 94,336 97,904 48,901 21.2 Rochester 24 60,483 56,228 45,675 19.2 Rutgers 13 80,556 75,339 58,464 24.1 Saskatchewan 7 89,380 87,564 64,347 14.4 South Carolina 8 56,003 49,872 40,000 20.6 Southern California 14 79,469 75,555 61,415 12.9 Southern Illinois 5 64,325 68,046 45,000 24.8 SUNY Buffalo 11 65,668 64,851 48,000 20.5 SUNY Stony Brook 12 74,502 71,400 47,000 14.1 Temple 8 61,733 63,844 50,000 19.3 Tennessee, Knoxville 5 53,281 52,847 45,000 15.4 Tennessee, Memphis 10 63,396 61,728 45,000 22.0 Texas Tech 18 53,136 50,122 41,434 17.9 Toronto 15 81,586 77,431 51,964 16.7 Tulane 13 46,319 47,954 45,000 17.9 Utah 15 68,264 63,450 50,000 14.7 Vanderbilt 13 63,185 61,825 57,000 14.5 Virginia 13 72,808 70,750 50,000 24.8 Washington 13 72,909 66,426 48,500 19.5 Washington U.-St. Louis 25 63,856 55,274 44,441 15.0 Wayne State 4 ‡ ‡ 54,000 20.5 Wisconsin 12 64,650 61,404 42,000 16.8 Yale 17 86,021 87,372 53,550 18.4 Directors are included in figures for filled positions and average years of experience, but not in either the average or median salary statistics. Canadian salaries are expressed in US dollars. ‡ Salary data are not published when fewer than four individuals are involved.
Help