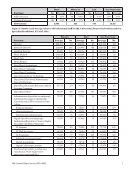
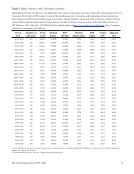
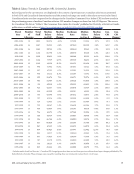
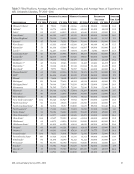
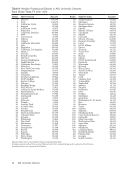
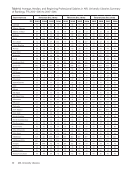
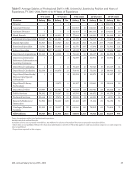
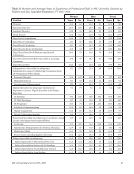
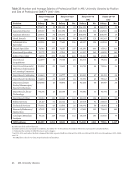
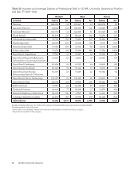
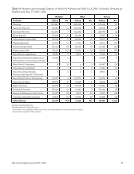
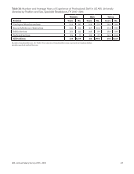
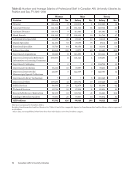
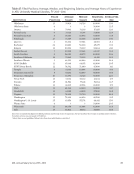
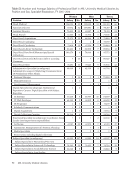
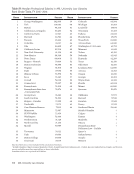
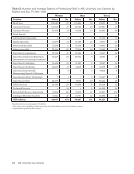
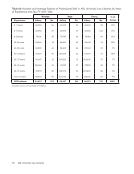
71 ARL Annual Salary Survey 2015–2016 Table 40: Filled Positions Average, Median, and Beginning Professional Salaries and Average Years of Professional Experience in Canadian ARL University Libraries, FY 2015–2016 Filled Positions Average Salaries Median Salaries Beginning Salaries Average Yrs. Exp. Institution FY 2016 FY 2015 FY 2016 FY 2015 FY 2016 FY 2015 FY 2016 FY 2016 Alberta* 68 102,565 104,432 97,690 101,395 59,807 59,577 14.4 British Columbia* 75 98,117 96,638 94,418 94,913 58,051 58,051 17.3 Calgary* 56 103,804 105,430 102,646 100,729 65,000 65,000 19.4 Guelph* 54 92,927 95,415 90,618 91,252 64,932 67,555 17.6 Laval* 67 77,369 76,967 79,047 79,047 55,394 51,733 15.3 McGill* 69 84,727 88,678 73,202 79,995 50,000 51,000 15.4 McMaster* 43 76,657 78,823 69,659 72,092 48,456 48,456 20.3 Manitoba* 39 104,531 103,670 98,004 99,833 56,037 57,158 20.8 Ottawa* 45 95,595 98,538 93,601 97,583 62,925 67,447 14.4 Queen`s* 33 111,023 117,132 118,775 123,435 56,935 57,504 22.4 Saskatchewan* 53 102,750 104,640 100,315 93,961 61,142 75,537 16.3 Toronto 164 100,402 98,321 99,822 96,147 58,100 61,000 16.6 Waterloo* 37 88,563 88,082 91,469 92,795 56,647 57,751 14.3 Western* 67 81,452 83,171 79,468 81,886 56,466 57,781 14.6 York* 55 115,337 117,043 117,462 117,597 49,000 49,000 15.5 Salaries are expressed in Canadian dollars. Excludes Canadian medical and law libraries. See Tables 47 and 57 for comparable figures for Canadian medical and law library salaries expressed in US dollars. Directors are included in figures for average years of experience and filled positions, but not in either the average or median salary statistics. *See Footnotes.
Help