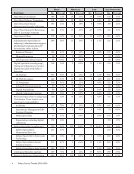
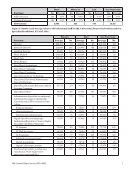
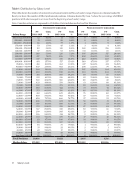
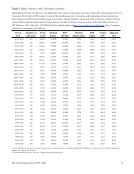
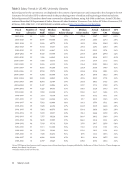
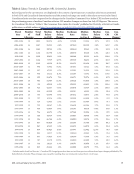
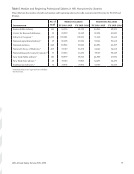
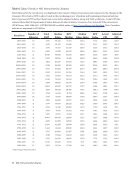
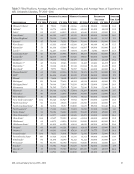
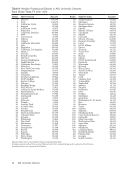
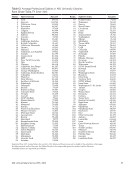
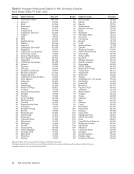
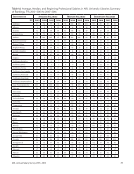
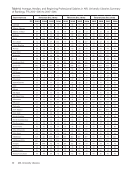
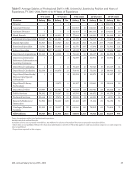
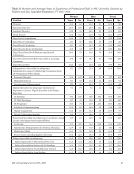
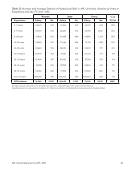
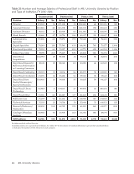
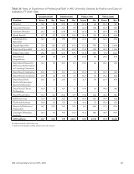
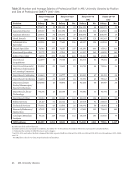
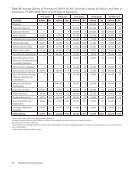
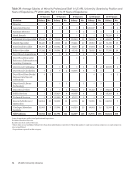
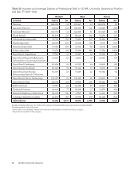
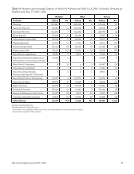
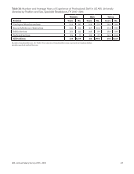
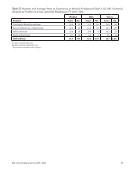
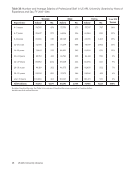
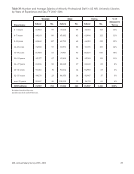
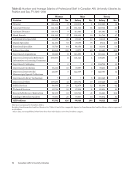
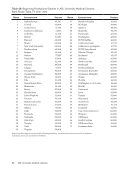
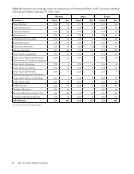
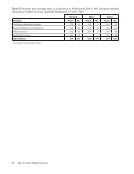
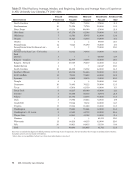
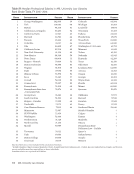
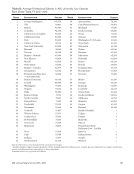
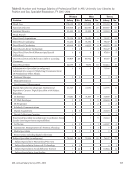
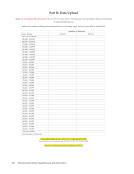
8 Salary Survey Trends 2015–2016 Position Women Men All Positions Average No. Average No. Average No. Archivists 64,422 420 69,216 248 66,202 668 Assessment, Management Info Systems, Planning 70,342 58 74,011 23 71,384 81 Media Specialists 61,845 40 63,561 62 62,888 102 Preservation, including digital collections 66,389 124 67,495 50 66,707 174 Subject Specialist (no subgroup) 70,454 627 72,223 279 70,999 906 Subject Specialist in Humanities/Fine Arts 73,408 143 81,103 89 76,360 232 Subject Specialist in Sciences &Technology 70,307 212 70,207 88 70,278 300 Subject Specialist in Social/Behavior Science 68,951 171 77,515 78 71,634 249 Subject Specialist in Area Studies 72,759 122 75,653 66 73,775 188 Catalogers/Metadata analysts 68,777 453 69,824 206 69,104 659 Research/Reference/Instruction 68,178 846 70,654 298 68,823 1,144 Public Services 63,838 206 66,588 87 64,655 293 Technical Services 62,433 115 67,834 40 63,827 155 All Positions: 77,297 6,410 81,144 3,701 78,705 10,111 In regards to the gender gap in ARL libraries discussed in the previous section, it is worth noting that the average salaries of men are higher than those of women in 31 out of the 38 categories in Figure 5. Institutional Characteristics and Salaries Public and Private Institutions The gap between salaries paid in private ARL university libraries and those paid in publicly supported ARL university libraries increased in 2015–2016 to 8.85%, with librarians at private institutions earning an average of $6,657 more than their peers at public institutions. Head, Acquisitions and Head, Circulation are the only two job categories where librarians in public institutions earned more than their counterparts in private institutions (see Table 23). Library Size Library size, as measured by the number of professional staff, is another significant determinant of salary. As a rule, the largest libraries tend to pay the highest average salaries, not only overall, but for specific positions as well. In 2015–2016, libraries with 75 to 110 staff reported the highest average salary, $80,111, followed by libraries with more than 110 staff, which reported the next highest average salary $80,059 (see Table 25). In 2015–2016 the gap between the highest paying cohort and the lowest paying cohort increased to $4,111. The cutoff staffing levels used to determine the largest cohort of libraries continued to hold steady at 110 in 2015–2016.4 4 In 1995–96, the largest cohort of libraries was determined based on staff over 124 in 1996–98, over 120 in 1998–99, over 115 and since 1999–2000, over 110. See Table 27.
Help