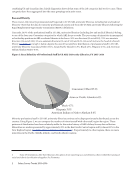
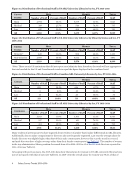
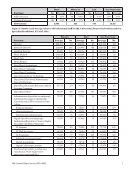
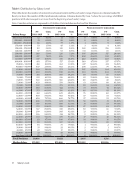
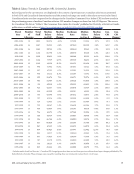
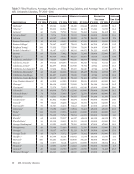
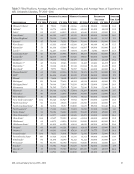
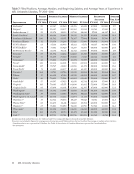
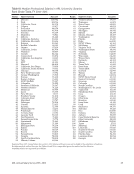
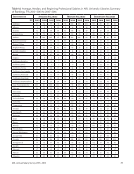
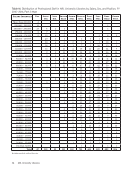
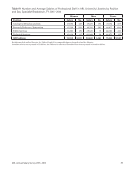
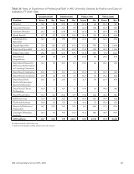
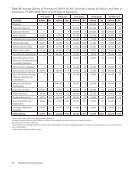
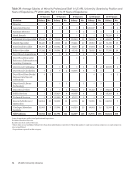
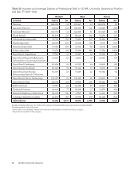
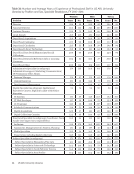
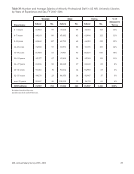
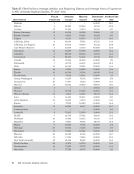
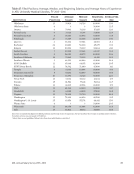
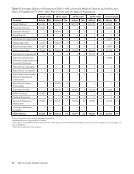
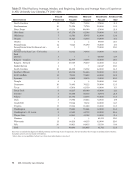
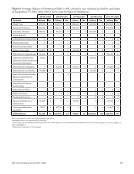
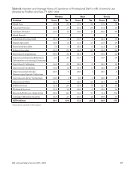
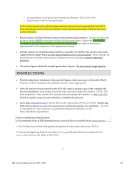
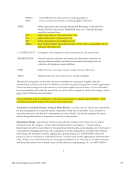
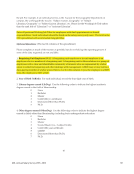
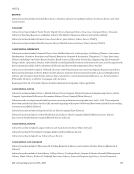
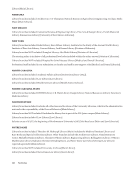
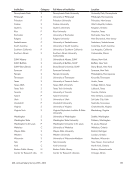
68 US ARL University Libraries Table 38: Number and Average Salaries of Professional Staff in US ARL University Libraries by Years of Experience and Sex, FY 2015–2016 Women Men Total %of US Total Experience Salary No. Salary No. Salary No. 0–3 years 54,785 474 57,553 273 55,797 747 10% 4–7 years 59,607 572 64,116 326 61,244 898 12% 8–11 years 65,686 725 68,549 438 66,765 1,163 15% 12–15 years 72,734 558 77,259 444 74,739 1,002 13% 16–19 years 79,463 533 84,021 345 81,254 878 12% 20–23 years 85,712 413 86,741 295 86,141 708 9% 24–27 years 85,052 404 89,225 262 86,694 666 9% 28–31 years 90,119 352 96,575 200 92,458 552 7% 32–35 years 92,932 285 97,173 146 94,368 431 6% over 35 years 103,804 363 110,167 215 106,171 578 8% All Positions: 76,143 4,679 80,191 2,944 77,706 7,623 100% Excludes Canadian libraries. See Table 46 for salaries of Canadian librarians expressed in Canadian dollars. Excludes medical and law libraries.
Help