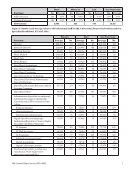
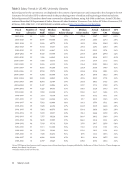
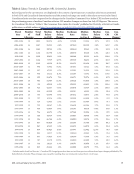
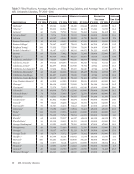
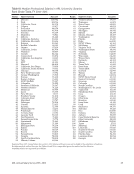
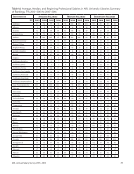
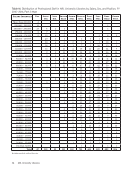
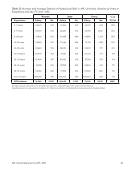
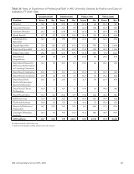
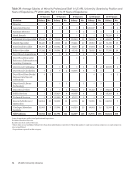
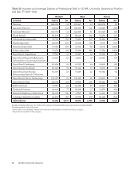
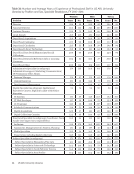
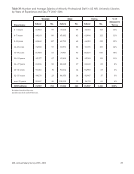
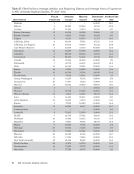
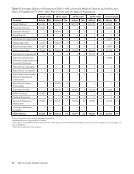
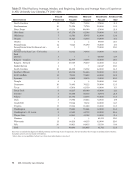
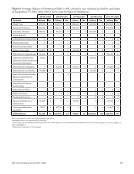
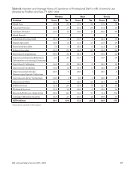
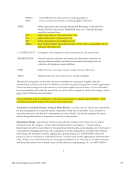
43 ARL Annual Salary Survey 2015–2016 Table 22: Number and Average Salaries of Professional Staff in ARL University Libraries by Years of Experience and Sex, FY 2015–2016 Women Men Total %of Total Experience Salary No. Salary No. Salary No. 0–3 years 54,823 542 57,466 301 55,767 843 10% 4–7 years 60,527 665 64,430 361 61,901 1,026 12% 8–11 years 67,034 833 69,358 480 67,884 1,313 15% 12–15 years 74,245 637 77,644 484 75,713 1,121 13% 16–19 years 80,448 594 84,083 381 81,869 975 11% 20–23 years 86,470 453 87,110 322 86,736 775 9% 24–27 years 86,009 457 89,843 291 87,501 748 9% 28–31 years 91,758 394 97,589 228 93,896 622 7% 32–35 years 94,014 320 97,918 166 95,348 486 6% over 35 years 104,189 410 110,706 229 106,525 639 7% All Positions: 76,968 5,305 80,640 3,243 78,361 8,548 100% Excludes medical and law libraries. See Tables 56 and 66 for comparable figures for medical and law libraries. Canadian salaries are expressed in US dollars. See Table 46 for salaries of Canadian librarians expressed in Canadian dollars.
Help