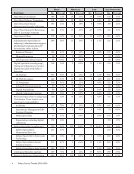
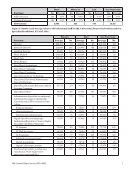
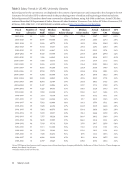
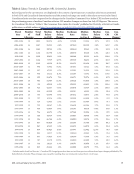
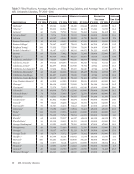
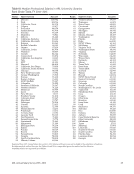
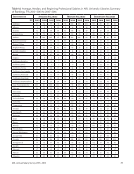
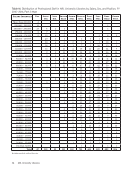
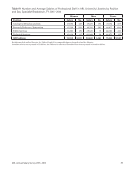
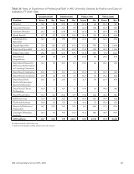
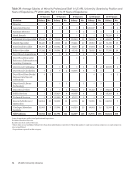
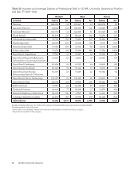
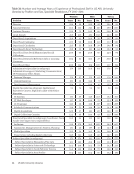
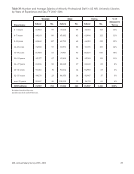
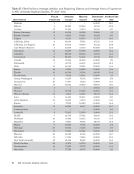
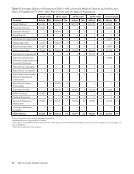
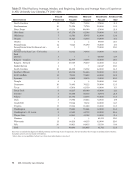
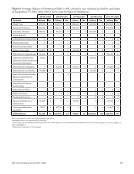
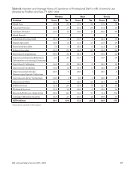
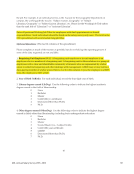
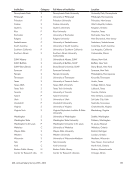
77 ARL Annual Salary Survey 2015–2016 Table 44: Number and Average Years of Experience of Professional Staff in Canadian ARL University Libraries by Position and Sex, FY 2015–2016 Women Men Total Position Years No. Years No. Years No. Director 26.5 11 36.5 4 29.2 15 Associate Director 24.7 26 21.1 14 23.5 40 Assistant Director 20.3 9 27.5 6 23.2 15 Head, Branch 22.2 37 20.1 10 21.7 47 Administrative Specialist 15.6 48 12.1 20 14.6 68 Digital Specialist 11.9 53 15.1 75 13.8 128 Functional Specialist 14.4 44 20.2 22 16.3 66 Subject Specialist 15.3 158 15.7 45 15.4 203 Dept. Head, Acquisitions 18.8 11 18.5 4 18.7 15 Dept. Head, Research/Reference/ Information or Learning Commons 15.0 11 19.3 4 16.1 15 Dept. Head, Cataloging 17.6 8 29.3 3 20.8 11 Dept. Head, Circulation 18.9 10 12.0 4 16.9 14 Dept. Head, Rare Books/ Manuscripts/Special Collections 15.2 5 21.0 7 18.6 12 Dept. Head, Library Technology 24.7 3 12.2 5 16.9 8 Dept. Head, Other 22.6 41 20.5 19 21.9 60 Public Services 10.5 30 15.5 12 11.9 42 Technical Services 12.2 10 13.6 11 13.0 21 Research/Reference/Instruction 14.4 83 16.0 21 14.7 104 Cataloger/Metadata Analysts 17.1 28 20.9 13 18.3 41 All Positions: 16.4 626 17.3 299 16.7 925 Excludes Canadian medical and law libraries. See Tables 54 and 64 for comparable figures for medical and law libraries.
Help