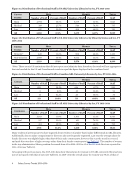
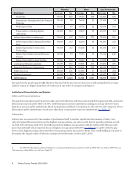
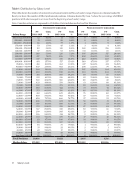
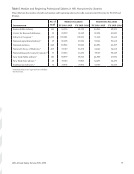
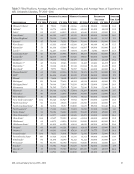
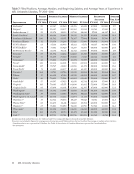
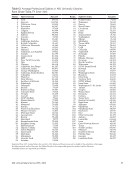
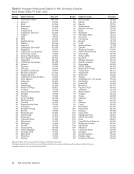
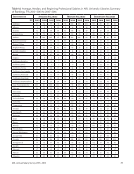
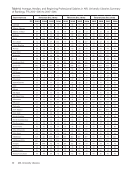
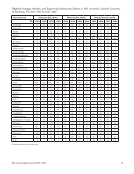
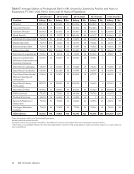
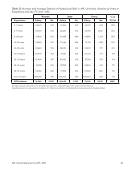
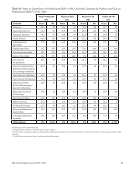
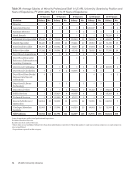
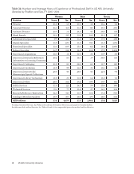
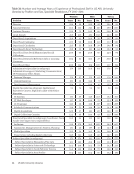
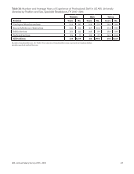
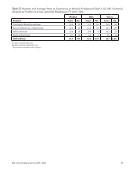
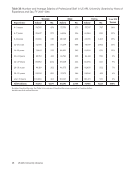
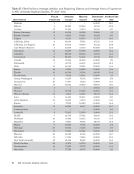
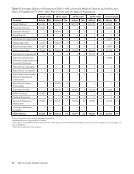
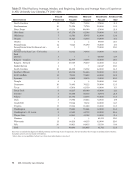
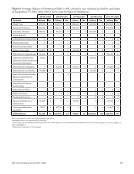
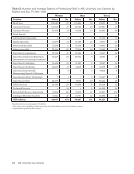
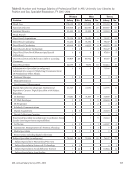
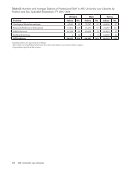
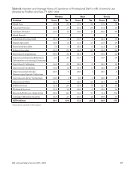
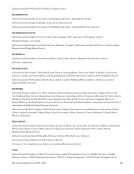
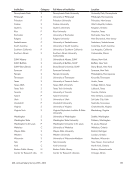
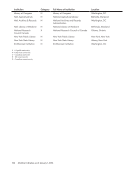
22 ARL University Libraries Table 7: Filled Positions Average, Median, and Beginning Salaries and Average Years of Experience in ARL University Libraries, FY 2015–2016 Filled Positions Average Salaries Median Salaries Beginning Salaries Average Yrs. Exp. Institution FY 2016 FY 2015 FY 2016 FY 2015 FY 2016 FY 2015 FY 2016 FY 2016 Rochester* 59 63,947 65,560 60,376 61,658 47,500 50,000 17.7 Rutgers* 85 93,647 95,477 90,362 91,944 50,765 57,500 21.1 Saskatchewan †* 53 95,974 89,139 93,700 80,041 57,110 64,347 16.3 South Carolina* 59 60,686 59,649 54,815 54,331 41,000 41,000 14.4 Southern California* 100 81,562 83,071 74,367 77,004 53,000 53,700 21.7 Southern Illinois 31 59,350 59,268 55,026 55,080 50,004 50,004 13.4 SUNY Albany* 63 67,136 68,993 65,162 67,171 40,137 40,940 19.6 SUNY Buffalo* 64 77,641 78,920 75,297 76,507 48,000 48,000 20.5 SUNY Stony Brook* 54 68,178 70,631 62,512 65,000 47,000 47,000 17.7 Syracuse* 69 68,394 72,462 62,240 66,515 38,000 38,000 21.7 Temple* 57 78,499 79,320 70,008 73,118 44,044 50,000 17.6 Tennessee* 43 73,833 76,370 69,271 71,557 48,000 50,000 14.8 Texas* 128 61,964 66,001 57,111 60,594 46,000 46,000 16.1 Texas A&M* 117 70,767 69,819 62,996 62,373 50,500 50,500 15.6 Texas Tech* 71 65,483 68,277 63,413 65,327 49,000 49,000 15.0 Toronto † 164 93,781 83,756 93,239 81,904 54,269 51,964 16.6 Tulane 37 66,638 67,516 62,728 62,992 44,000 45,000 18.7 Utah* 46 70,423 71,594 60,883 62,649 53,000 53,000 16.7 Vanderbilt* 57 69,397 67,923 61,638 61,744 42,500 57,000 21.2 Virginia* 143 70,683 65,971 64,600 61,682 52,000 55,000 16.8 Virginia Tech* 68 67,490 66,601 65,000 62,395 47,000 48,000 13.3 Washington* 106 71,692 73,444 67,680 70,128 48,204 48,500 19.9 Washington State* 39 67,866 63,386 64,891 58,822 42,000 42,000 16.4 Washington U.-St. Louis* 69 66,950 67,262 61,644 61,133 41,000 42,000 16.9 Waterloo †* 37 82,722 75,033 85,437 79,048 52,911 49,196 14.3 Wayne State* 68 66,475 66,211 64,140 63,392 46,000 50,000 14.7 Western †* 67 76,081 70,850 74,228 69,756 52,742 49,221 14.6 Wisconsin* 133 68,352 69,105 64,236 64,243 44,000 42,000 19.2 Yale* 183 85,374 89,713 82,471 85,143 53,550 53,550 19.4 York †* 55 107,731 99,704 109,716 100,176 45,769 41,741 15.5 Excludes medical and law libraries. See Tables 47 and 57 for comparable figures for medical and law libraries. Directors are included in figures for average years of experience and filled positions, but not in either the average or median salary statistics. † Canadian salaries are expressed in US dollars. See Table 40 for salaries of Canadian librarians expressed in Canadian dollars. *See Footnotes.
Help