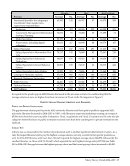
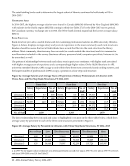
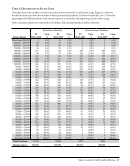
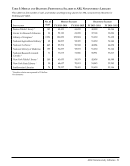
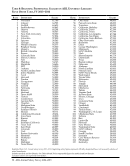
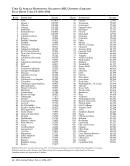
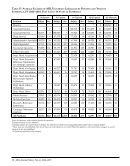
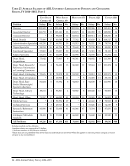
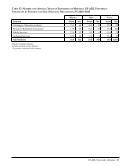
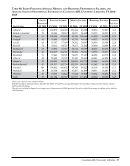
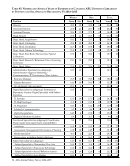
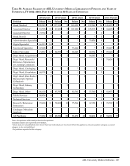
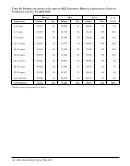
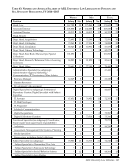
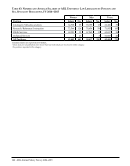
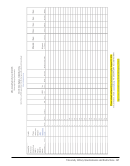
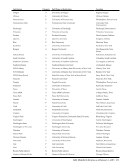
US ARL University Libraries · 71 Table 29: Average Salaries of Minority US ARL University Librarians by Position and Years of Experience, FY 2014–2015, Part 2: 20 to over 35 Years of Experience 20–23 years 24–27 years 28–31 years 32–35 years over 35 years Position Salary No. Salary No. Salary No. Salary No. Salary No. Director ‡ 1 ‡ 1 ‡ 1 ‡ 1 ‡ 3 Associate Director ‡ 1 ‡ 1 ‡ 2 130,398 8 Assistant Director ‡ 2 ‡ 3 ‡ 1 ‡ 2 Head, Branch 70,953 5 ‡ 2 ‡ 3 ‡ 2 102,567 4 Administrative Specialist 69,823 13 77,930 10 77,372 7 68,369 5 ‡ 2 Digital Specialist 69,845 6 80,993 12 ‡ 2 ‡ 1 ‡ 3 Functional Specialist 82,269 11 70,196 7 ‡ 3 ‡ 3 ‡ 2 Subject Specialist 73,567 27 76,859 12 80,719 10 81,068 15 92,919 8 Dept. Head, Acquisitions ‡ 1 ‡ 1 ‡ 1 ‡ 1 Dept. Head, Research/ Reference/Information or Learning Commons ‡ 3 ‡ 1 Dept. Head, Cataloging 82,189 4 ‡ 2 ‡ 1 ‡ 1 ‡ 1 Dept. Head, Circulation ‡ 1 ‡ 1 ‡ 2 Dept. Head, Rare Books/ Manuscripts/Special Collections ‡ 2 ‡ 1 ‡ 1 Dept. Head, Library Technology ‡ 3 ‡ 2 Dept. Head, Other 90,673 14 101,417 9 98,646 8 ‡ 2 104,848 6 Public Services ‡ 3 ‡ 1 Technical Services ‡ 1 ‡ 1 Research/Reference/ Instruction 77,625 10 75,663 7 ‡ 2 ‡ 2 79,128 8 Cataloger/Metadata Analysts 71,963 6 74,351 7 ‡ 2 ‡ 5 81,195 7 All Positions: 81,897 107 84,312 80 88,536 45 82,128 42 99,510 59 Years of experience reflect total professional experience. Excludes Canadian libraries. Excludes medical and law libraries. ‡ Salary data are not published when fewer than four individuals are involved. When this applies to only one position category, a second category is also not published. .No positions reported in this category.
Help