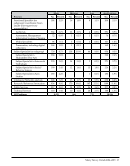
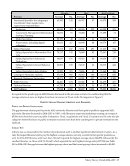
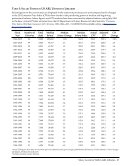
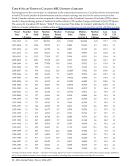
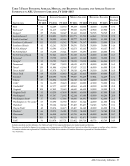
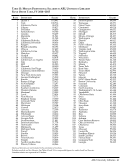
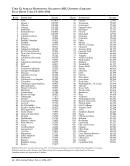
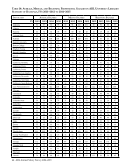
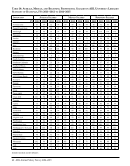
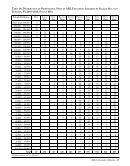
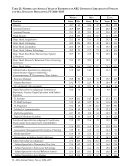
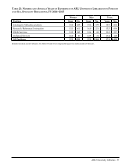
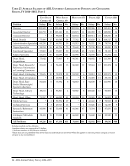
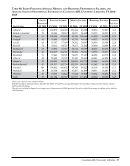
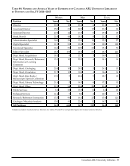
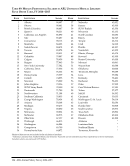
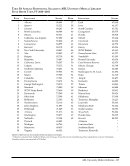
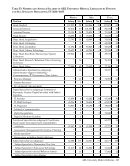
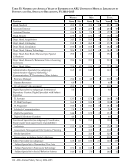
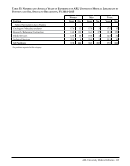
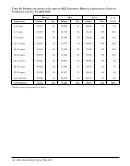
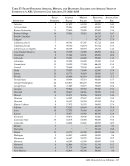
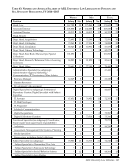
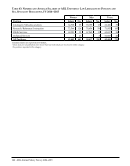
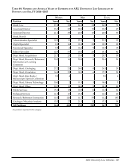
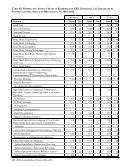
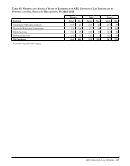
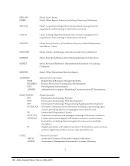
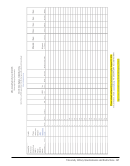
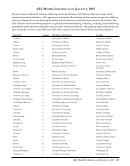
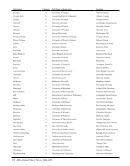
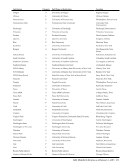
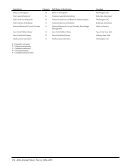
ARL University Libraries · 37 Filled Positions Average Salaries Median Salaries Beginning Salaries Average Yrs. Exp. Institution FY 2015 FY 2014 FY 2015 FY 2014 FY 2015 FY 2014 FY 2015 FY 2015 Rice 64 64,409 63,733 59,325 60,000 40,300 40,300 17.6 Rochester‡ 65 61,417 63,947 59,528 60,376 47,500 47,500 17.3 Rutgers‡ 87 95,004 93,647 92,443 90,362 50,765 50,765 21.5 Saskatchewan‡ 47 100,853 95,974 101,771 93,700 60,862 57,110 17.0 South Carolina‡ 56 58,990 60,686 55,777 54,815 38,000 41,000 14.8 Southern California‡ 113 83,333 81,562 75,990 74,367 49,000 53,000 21.4 Southern Illinois 41 62,261 59,350 59,076 55,026 50,000 50,004 14.6 SUNY Albany‡ 65 63,596 67,136 62,073 65,162 39,350 40,137 19.7 SUNY Buffalo‡ 63 76,258 77,641 73,869 75,297 47,000 48,000 19.1 SUNY Stony Brook 54 87,042 68,178 81,338 62,512 45,000 47,000 16.7 Syracuse‡ 75 70,758 68,394 64,825 62,240 38,000 38,000 19.1 Temple‡ 52 74,792 78,499 70,039 70,008 44,044 44,044 17.7 Tennessee‡ 44 72,847 73,833 68,639 69,271 48,000 48,000 16.3 Texas‡ 139 61,884 61,964 57,047 57,111 46,000 46,000 15.0 Texas A&M‡ 113 67,078 70,767 59,018 62,996 50,500 50,500 16.0 Texas Tech 68 65,358 65,483 62,220 63,413 49,000 49,000 13.7 Toronto‡ 148 100,390 93,781 99,087 93,239 57,834 54,269 17.1 Tulane 37 66,854 66,638 62,728 62,728 44,000 44,000 17.4 Utah‡ 51 66,199 70,423 60,867 60,883 47,000 53,000 18.1 Vanderbilt‡ 58 67,177 69,397 60,863 61,638 42,500 42,500 21.8 Virginia‡ 108 67,853 70,683 64,600 64,600 52,000 52,000 17.9 Virginia Tech‡ 53 63,230 67,490 58,000 65,000 44,000 47,000 14.5 Washington‡ 108 67,367 71,692 62,244 67,680 45,000 48,204 20.0 Washington State‡ 37 63,851 67,866 60,000 64,891 40,000 42,000 21.3 Washington U.-St. Louis‡ 65 65,690 66,950 60,067 61,644 42,000 41,000 18.2 Waterloo‡ 34 85,162 82,722 87,405 85,437 54,745 52,911 15.1 Wayne State‡ 48 65,274 66,475 63,407 64,140 45,000 46,000 15.4 Western‡ 66 78,973 76,081 77,259 74,228 55,377 52,742 15.2 Wisconsin‡ 132 66,058 68,352 61,785 64,236 45,000 44,000 18.7 Yale 205 84,722 85,374 80,611 82,471 55,000 53,550 18.3 York‡ 56 110,874 107,731 111,462 109,716 48,776 45,769 14.9 Excludes medical and law libraries. See Tables 47 and 57 for comparable figures for medical and law libraries. Directors are included in figures for average years of experience and filled positions, but not in either the average or median salary statistics. † Canadian salaries are expressed in US dollars. See Table 40 for salaries of Canadian librarians expressed in Canadian dollars. ‡ See Footnotes. Table 7: Filled Positions Average, Median, and Beginning Salaries and Average Years of Experience in ARL University Libraries, FY 2014–2015
Help