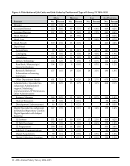
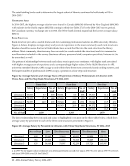
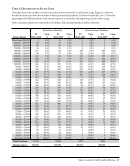
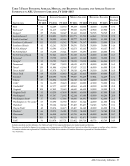
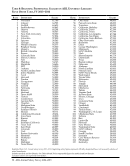
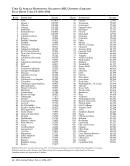
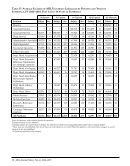
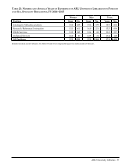
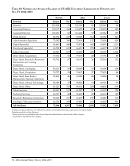
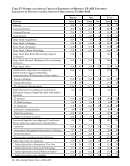
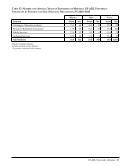
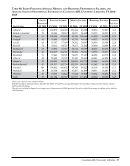
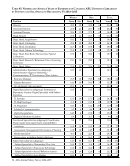
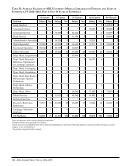
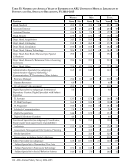
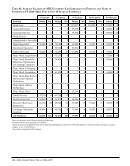
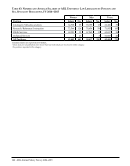
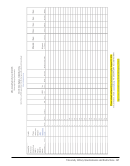
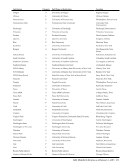
70 · ARL Annual Salary Survey 2014–2015 Table 29: Average Salaries of Minority US ARL University Librarians by Position and Years of Experience, FY 2014–2015, Part 1: 0 to 19 Years of Experience 0–3 years 4–7 years 8–11 years 12–15 years 16–19 years Position Salary No. Salary No. Salary No. Salary No. Salary No. Director ‡ 1 ‡ 2 ‡ 2 Associate Director ‡ 1 ‡ 3 156,021 4 Assistant Director ‡ 2 ‡ 1 Head, Branch ‡ 1 ‡ 1 69,581 4 83,000 11 Administrative Specialist 64,799 11 64,615 5 60,947 11 77,228 16 ‡ 1 Digital Specialist 55,643 29 64,333 33 67,342 41 71,543 25 79,221 16 Functional Specialist 54,310 28 60,049 22 62,436 24 66,773 12 57,380 5 Subject Specialist 55,857 26 59,620 33 65,104 53 70,029 38 76,932 30 Dept. Head, Acquisitions ‡ 1 ‡ 3 ‡ 1 ‡ 3 Dept. Head, Research/ Reference/Information or Learning Commons ‡ 3 ‡ 2 ‡ 2 Dept. Head, Cataloging ‡ 2 ‡ 3 ‡ 3 78,459 7 Dept. Head, Circulation ‡ 3 ‡ 3 ‡ 1 Dept. Head, Rare Books/ Manuscripts/Special Collections ‡ 1 ‡ 1 ‡ 1 ‡ 1 Dept. Head, Library Technology ‡ 1 ‡ 2 ‡ 3 Dept. Head, Other ‡ 1 70,679 4 72,141 6 69,829 4 80,401 9 Public Services ‡ 3 58,303 7 ‡ 2 59,195 5 ‡ 2 Technical Services 50,259 8 63,225 5 ‡ 1 ‡ 1 Research/Reference/ Instruction 51,210 18 57,845 18 64,200 19 69,182 14 64,155 8 Cataloger/Metadata Analysts 52,140 8 59,055 12 60,773 19 66,643 13 68,392 8 All Positions: 55,556 126 60,775 152 65,691 196 75,160 152 82,532 108 Years of experience reflect total professional experience. Excludes Canadian libraries. Excludes medical and law libraries. ‡ Salary data are not published when fewer than four individuals are involved. When this applies to only one position category, a second category is also not published. .No positions reported in this category.
Help