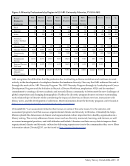
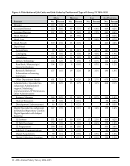
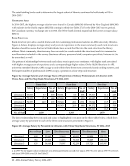
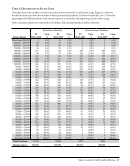
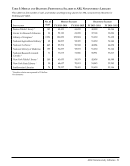
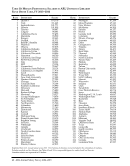
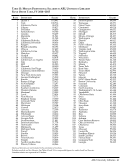
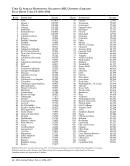
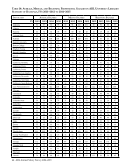
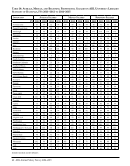
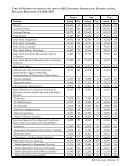
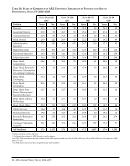
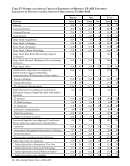
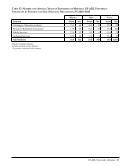
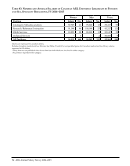
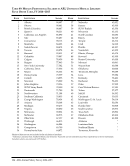
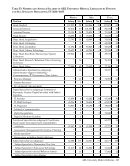
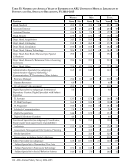
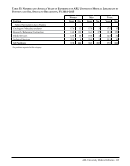
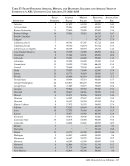
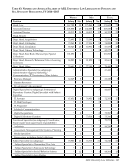
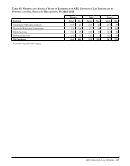
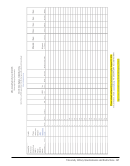
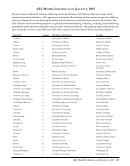
Salary Levels for Staff in ARL Libraries · 25 Table 1: Distribution by Salary Level This table shows the number of university and nonuniversity staff in each salary range. Figures in columns headed by fiscal year show the number of filled professional positions. Columns headed by Cum. %show the percentage of all filled positions with salaries equal to or more than the beginning of each salary range. Note: Canadian salaries are expressed in US dollars. Data includes medical and law libraries. University Libraries Nonuniversity Libraries FY Cum. FY Cum. FY Cum. FY Cum. Salary Range 2013–2014 %2014–2015 %2013–2014 %2014–2015 %More than 300,000 9 0.1% 12 0.1% 0 0.0% 0 0.0% 250,000 -299,999 20 0.3% 21 0.3% 0 0.0% 0 0.0% 200,000 -250,000 80 1.1% 86 1.2% 6 0.2% 1 0.0% 175,000 -199,999 56 1.6% 53 1.7% 4 0.3% 3 0.1% 150,000 -174,999 112 2.7% 112 2.8% 305 8.3% 288 8.0% 140,000 -149,999 96 3.7% 97 3.8% 140 12.0% 133 11.7% 130,000 -139,999 167 5.3% 148 5.3% 244 18.4% 305 20.1% 120,000 -129,999 203 7.3% 217 7.4% 237 24.7% 202 25.6% 110,000 -119,999 329 10.5% 337 10.8% 396 35.1% 448 38.0% 100,000 -109,999 466 15.1% 491 15.7% 453 47.1% 340 47.3% 95,000 -99,999 347 18.5% 318 18.9% 242 53.5% 337 56.6% 90,000 -94,999 432 22.8% 467 23.5% 220 59.3% 205 62.2% 85,000 -89,999 499 27.7% 564 29.1% 205 64.7% 207 67.9% 80,000 -84,999 615 33.7% 620 35.3% 260 71.5% 224 74.1% 78,000 -79,999 312 36.8% 314 38.4% 77 73.6% 60 75.7% 76,000 -77,999 312 39.9% 333 41.7% 118 76.7% 83 78.0% 74,000 -75,999 368 43.5% 345 45.2% 140 80.4% 115 81.2% 72,000 -73,999 348 46.9% 423 49.4% 49 81.7% 61 82.9% 70,000 -71,999 456 51.4% 359 53.0% 61 83.3% 90 85.3% 68,000 -69,999 336 54.7% 380 56.8% 110 86.2% 73 87.3% 66,000 -67,999 405 58.7% 373 60.5% 65 87.9% 48 88.7% 64,000 -65,999 388 62.5% 413 64.6% 35 88.8% 76 90.8% 62,000 -63,999 438 66.8% 460 69.2% 97 91.4% 67 92.6% 60,000 -61,999 470 71.4% 450 73.7% 40 92.4% 27 93.3% 58,000 -59,999 421 75.6% 406 77.7% 45 93.6% 58 94.9% 56,000 -57,999 390 79.4% 397 81.7% 68 95.4% 31 95.8% 54,000 -55,999 377 83.1% 372 85.4% 26 96.1% 27 96.5% 52,000 -53,999 372 86.8% 367 89.0% 36 97.0% 50 97.9% 50,000 -51,999 367 90.4% 299 92.0% 50 98.4% 13 98.3% 48,000 -49,999 271 93.1% 226 94.3% 6 98.5% 9 98.5% 46,000 -47,999 239 95.4% 183 96.1% 11 98.8% 17 99.0% 44,000 -45,999 156 96.9% 121 97.3% 8 99.0% 14 99.4% 42,000 -43,999 109 98.0% 90 98.2% 17 99.5% 9 99.6% 40,000 -41,999 77 98.8% 84 99.0% 10 99.7% 1 99.6% 38,000 -39,999 58 99.3% 33 99.4% 4 99.8% 2 99.7% 36,000 -37,999 20 99.5% 23 99.6% 1 99.9% 3 99.8% 34,000 -35,999 15 99.7% 13 99.7% 0 99.9% 0 99.8% less than 34,000 32 100.0% 29 100.0% 5 100.0% 8 100.0% Total Positions 10,168 10,036 3,791 3,635 Median Salary $70,585 $71,589 $95,173 $95,329
Help