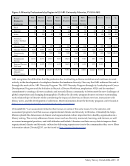
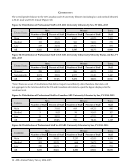
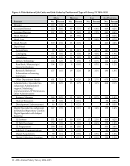
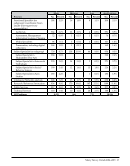
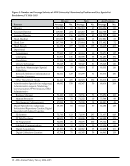
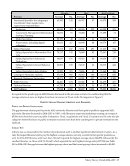
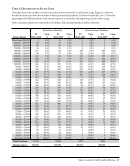
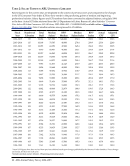
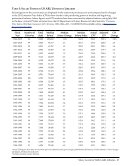
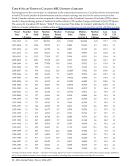
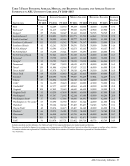
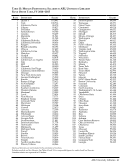
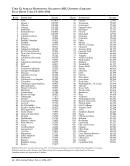
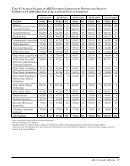
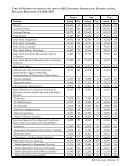
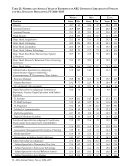
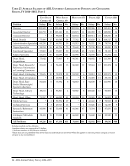
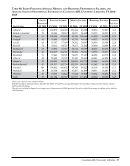
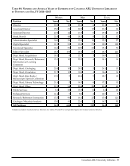
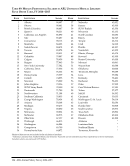
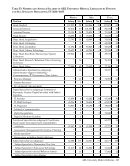
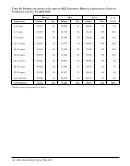
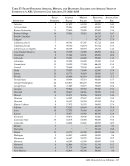
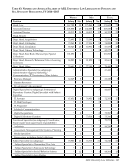
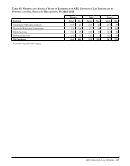
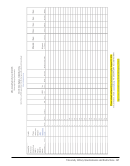
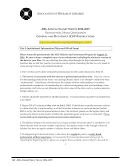
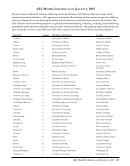
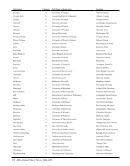
Salary Survey Trends 2014–2015 · 19 Position Women Men All Positions Average No. Average No. Average No. Functional Specialist (no subgroup) Coordinator, Team Leader (non- supervisory responsibility) 63,583 141 69,767 67 65,575 208 Archivists 63,650 372 68,345 219 65,390 591 Assessment, Management Information Systems, Planning 70,652 51 72,088 23 71,098 74 Media Specialists 59,171 40 61,140 61 60,360 101 Preservation, including digital collections 65,631 117 68,890 48 66,579 165 Subject Specialist 70,573 637 73,851 297 71,615 934 Subject Specialist in Humanities/Fine Arts 70,215 145 74,888 93 72,041 238 Subject Specialist in Sciences &Technology 68,087 191 69,922 80 68,629 271 Subject Specialist in Social/Behavior Science 66,805 158 72,133 66 68,375 224 Subject Specialist in Area Studies 73,289 119 73,486 67 73,360 186 Catalogers/Metadata analysts 67,614 468 69,362 190 68,119 658 Research/Reference/Instruction 68,671 872 68,981 317 68,754 1,189 Public Services 64,207 194 65,046 83 64,459 277 Technical Services 61,743 112 59,392 36 61,172 148 All Positions: 77,014 6,380 80,629 3,656 78,331 10,036 In regards to the gender gap in ARL libraries discussed in the previous section, it is worth noting that the average salaries of men are higher than those of women in 29 out of the 38 categories in Figure 5. Institutional Characteristics and Salaries Public and Private Institutions The gap between salaries paid in private ARL university libraries and those paid in publicly supported ARL university libraries decreased in 2014–2015 to 7.48%, with librarians at private institutions earning an average of $5,566 more than their peers at public institutions. Head, Acquisitions and Head, Circulation are the only two job categories where librarians in public institutions earned more than their counterparts in private institutions (see Table 23). Library Size Library size, as measured by the number of professional staff, is another significant determinant of salary. As a rule, the largest libraries tend to pay the highest average salaries, not only overall, but for specific positions as well. In 2014–2015 libraries with more than 110 staff reported the highest average salary, $80,578, followed by the smallest libraries, i.e. those with 23-49 staff, which reported the next highest average salary $77,334 (see Table 25). In 2014–2015 the gap between the highest paying cohort and the lowest paying cohort increased to $3,492.
Help