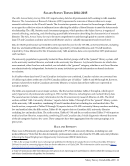
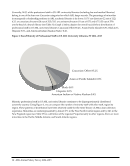
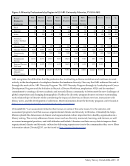
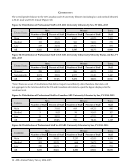
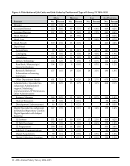
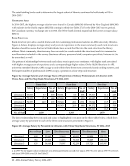
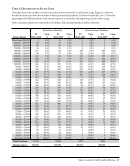
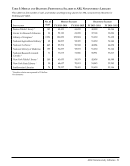
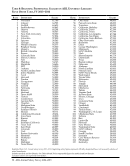
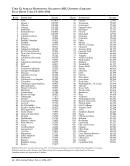
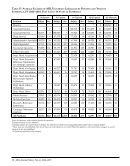
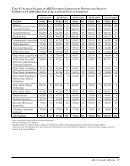
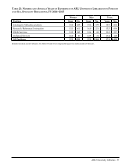
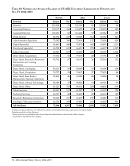
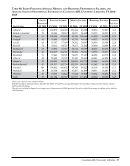
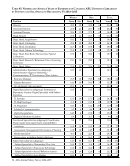
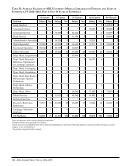
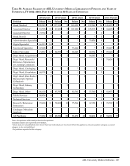
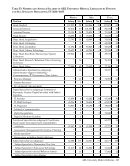
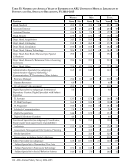
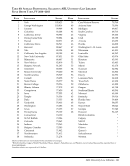
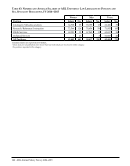
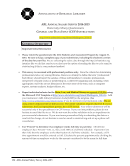
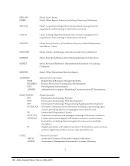
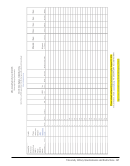
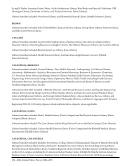
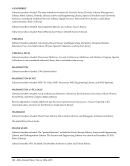
60 · ARL Annual Salary Survey 2014–2015 Table 24: Years of Experience of ARL University Librarians by Position and Type of Institution, FY 2014–2015 Canadian (16) Private (31) Public (68) Total (115) Position Years No. Years No. Years No. Years No. Director 31.4 16 32.5 30 33.8 66 33.1 112 Associate Director 23.2 36 27.6 98 25.7 189 26.0 323 Assistant Director 19.4 18 24.2 77 22.0 62 22.8 157 Head, Branch 21.2 52 23.1 107 21.8 220 22.1 379 Administrative Specialist 15.3 57 16.5 159 17.6 267 17.0 483 Digital Specialist 12.8 128 13.2 430 12.9 681 13.0 1,239 Functional Specialist 15.1 73 14.5 396 13.6 611 14.0 1,080 Subject Specialist 14.7 221 18.0 492 17.1 874 17.0 1,587 Dept. Head, Acquisitions 16.9 11 19.7 30 21.9 58 20.7 99 Dept. Head, Research/ Reference/Information or Learning Commons 18.1 14 20.3 50 19.3 73 19.5 137 Dept. Head, Cataloging 26.1 13 21.3 62 22.0 76 22.1 151 Dept. Head, Circulation 18.6 14 17.3 36 21.1 60 19.5 110 Dept. Head, Rare Books/Manuscripts/ Special Collections 18.7 10 21.7 38 22.8 56 22.0 104 Dept. Head, Library Technology 17.2 13 16.6 36 19.3 55 18.1 104 Dept. Head, Other 21.4 82 20.5 176 19.9 343 20.3 601 Public Services 9.4 39 14.2 64 13.9 114 13.2 217 Technical Services 10.7 9 17.6 28 15.2 81 15.4 118 Research/Reference/ Instruction 15.4 121 15.7 229 15.5 484 15.5 834 Cataloger/Metadata Analysts 16.7 53 18.9 259 18.5 292 18.5 604 All Positions: 16.4 980 17.7 2,797 17.3 4,662 17.3 8,439 Excludes medical and law libraries. ()Indicates the number of ARL libraries in each category.
Help