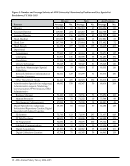
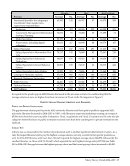
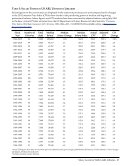
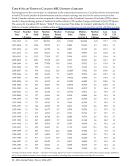
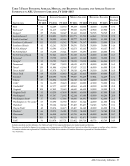
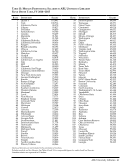
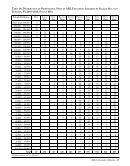
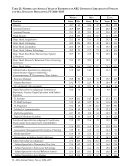
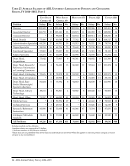
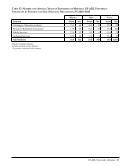
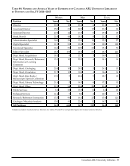
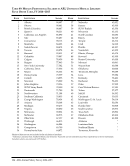
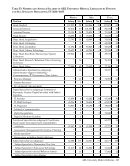
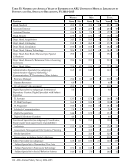
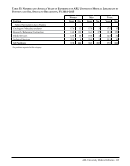
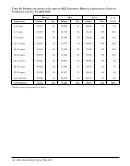
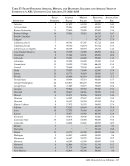
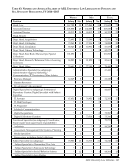
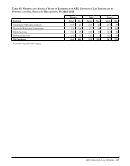
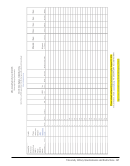
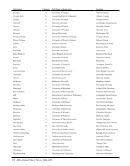
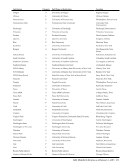
102 · ARL Annual Salary Survey 2014–2015 Institution Filled Positions Average Salary Median Salary Beginning Salary Average Yrs. Exp. Ohio State 9 73,398 67,157 50,000 20.1 Oklahoma 8 57,698 60,000 40,000 17.8 Oklahoma State 4 55,324 49,416 38,000 21.5 Ottawa 6 87,761 90,641 58,775 14.3 Pennsylvania 9 74,674 75,559 51,000 21.4 Pennsylvania State 8 63,372 64,872 49,000 12.8 Pittsburgh 28 71,649 66,813 46,000 18.5 Queen`s 5 92,322 90,221 53,180 19.0 Rochester 25 59,891 58,423 45,000 19.6 Rutgers 13 82,718 77,943 58,464 23.2 Saskatchewan 7 87,060 84,472 57,110 14.1 South Carolina 8 54,983 49,872 38,750 19.6 Southern California 14 78,261 70,855 56,275 16.9 Southern Illinois 4 ‡ ‡ 41,000 29.8 SUNY Buffalo 11 63,561 63,330 48,000 19.9 SUNY Stony Brook 13 73,658 72,500 47,000 16.8 Temple 8 61,457 62,316 46,000 18.0 Tennessee, Knoxville 4 ‡ ‡ 45,000 17.0 Tennessee, Memphis 14 56,211 59,685 45,000 17.8 Texas Tech 22 53,206 49,804 40,621 19.3 Toronto 14 89,203 83,978 54,269 14.6 Tulane 7 60,864 57,477 44,000 20.3 Utah 14 67,648 62,110 44,000 18.2 Vanderbilt 13 63,185 61,825 45,000 13.5 Virginia 13 68,542 69,050 48,000 24.8 Washington 16 70,877 66,084 48,204 22.0 Washington U.-St. Louis 25 62,396 54,019 43,563 15.9 Wayne State 5 59,826 60,388 50,000 17.4 Wisconsin 13 64,779 63,132 44,000 16.2 Yale 18 83,803 85,287 53,550 18.3 Directors are included in figures for filled positions and average years of experience, but not in either the average or median salary statistics. Canadian salaries are expressed in US dollars. ‡ Salary data are not published when fewer than four individuals are involved. Table 47: Filled Positions Average, Median, and Beginning Salaries and Average Years of Experience in ARL University Medical Libraries, FY 2014–2015
Help