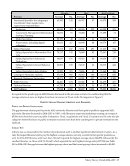
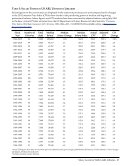
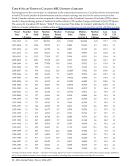
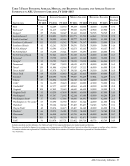
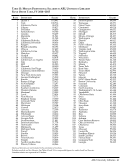
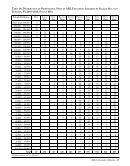
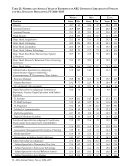
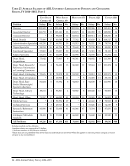
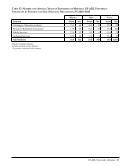
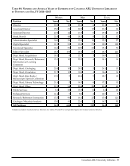
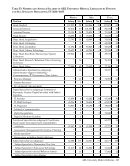
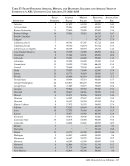
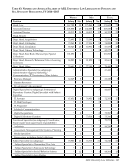
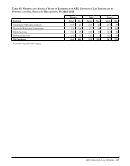
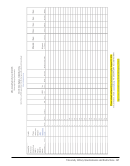
58 · ARL Annual Salary Survey 2014–2015 Table 22: Number and Average Salaries of ARL University Librarians by Years of Experience and Sex, FY 2014–2015 Women Men Total %of Total Experience Salary No. Salary No. Salary No. 0–3 years 54,273 538 58,281 302 55,714 840 10% 4–7 years 61,109 674 64,025 389 62,176 1,063 13% 8–11 years 67,028 766 69,722 451 68,026 1,217 14% 12–15 years 74,416 677 75,824 476 74,997 1,153 14% 16–19 years 79,149 566 83,393 371 80,829 937 11% 20–23 years 83,931 418 87,055 296 85,226 714 8% 24–27 years 84,826 466 86,832 283 85,584 749 9% 28–31 years 91,839 386 98,603 230 94,364 616 7% 32–35 years 97,092 348 101,030 178 98,424 526 6% over 35 years 103,611 396 109,638 228 105,813 624 7% All Positions: 76,750 5,235 80,207 3,204 78,063 8,439 100% Excludes medical and law libraries. See Tables 56 and 66 for comparable figures for medical and law libraries. Canadian salaries are expressed in US dollars. See Table 46 for salaries of Canadian librarians expressed in Canadian dollars.
Help