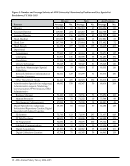
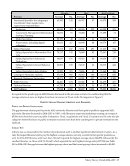
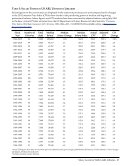
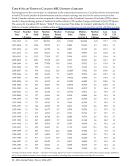
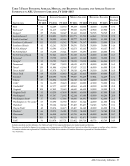
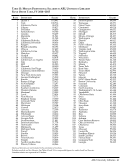
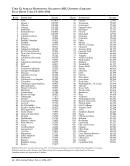
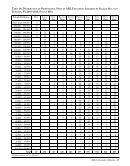
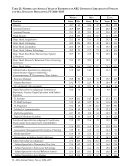
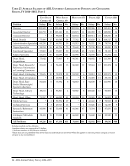
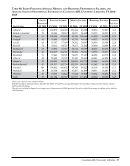
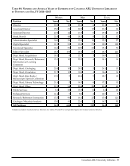
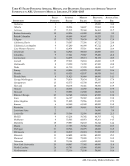
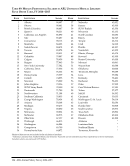
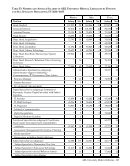
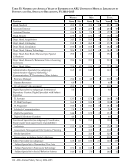
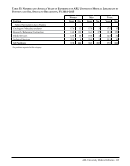
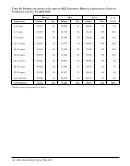
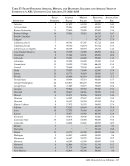
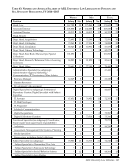
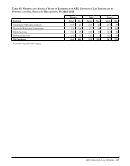
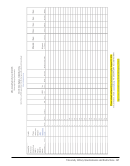
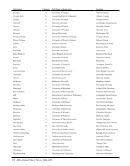
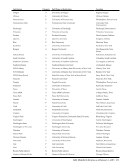
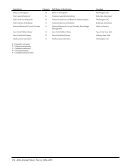
118 · ARL Annual Salary Survey 2014–2015 Institution Filled Positions Average Salary Median Salary Beginning Salary Average Yrs. Exp. New York University 18 87,431 79,743 70,000 25.7 North Carolina 11 78,769 75,035 45,000 13.6 Northwestern 7 71,412 67,525 51,000 16.4 Notre Dame 13 78,277 73,738 47,000 20.7 Ohio State 8 63,976 60,798 50,000 7.3 Oklahoma 7 61,800 54,637 42,000 19.9 Oregon 8 61,758 63,757 45,000 16.9 Ottawa 4 ‡ ‡ 58,775 21.5 Pennsylvania 15 75,129 73,540 51,000 17.9 Pennsylvania State 6 90,082 84,096 65,000 25.2 Queen`s 3 ‡ ‡ 53,180 14.7 Rutgers, Camden 7 72,385 72,550 70,000 17.9 Rutgers, Newark 9 81,245 77,557 68,000 15.9 Saskatchewan 2 ‡ ‡ 57,110 32.0 South Carolina 9 69,713 71,859 55,000 15.0 Southern Illinois 5 60,294 56,646 50,000 10.2 SUNY Buffalo 12 73,586 70,278 60,000 17.3 Syracuse 9 62,982 59,076 46,700 19.9 Temple 6 76,556 57,181 46,000 23.3 Tennessee 10 80,303 78,573 55,000 14.0 Texas 16 75,155 60,000 43,000 15.3 Texas Tech 7 61,920 61,500 55,000 11.7 Toronto 6 99,909 104,219 54,269 21.8 Tulane 8 63,403 63,395 45,000 15.3 Utah 8 68,788 68,516 52,500 16.6 Vanderbilt 7 75,433 71,558 60,000 13.7 Virginia 16 69,100 66,700 65,000 16.7 Washington 17 75,286 70,140 62,000 22.9 Washington U.-St. Louis 7 66,623 62,850 50,000 23.4 Wayne State 5 58,042 56,656 50,000 20.6 Western 2 ‡ ‡ 52,742 24.0 Wisconsin 12 65,101 60,139 44,000 20.8 Yale 21 88,134 80,500 53,550 16.3 York 5 105,623 112,608 45,769 13.6 Directors are included in figures for filled positions and average years of experience, but not in either the average or median salary statistics. Canadian salaries are expressed in US dollars. ‡ Salary data are not published when fewer than four individuals are involved. Table 57: Filled Positions Average, Median, and Beginning Salaries and Average Years of Experience in ARL University Law Libraries, FY 2014–2015
Help