Data Tables 2012–2013 · 19
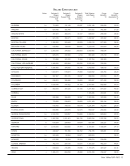
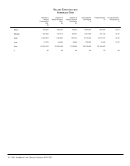
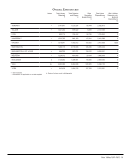
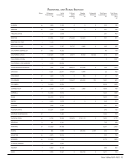
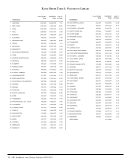
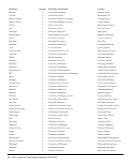
Overall Expenditures
+
+
+
+
+
+
b
b+
+
1,141,441
1,241,204
890,775
1,533,765
1,516,641
1,280,115
928,790
1,229,312
1,140,484
3,483,089
943,438
1,123,027
879,522
756,442
840,183
1,783,812
2,178,698
957,701
407,645
1,309,981
2,484,698
1,464,235
88,444
6,659
58,736
117,641
150,555
126,436
136,510
29,579
118,835
528,365
107,328
2,352,913
2,127,385
1,705,953
2,491,589
3,451,008
3,585,249
2,023,001
1,666,536
2,569,300
6,496,152
2,515,001
.
.
0
0
1,850
.
0
0
0
0
0
TORONTO
TULANE
UTAH
VANDERBILT
VIRGINIA
WASHINGTON
WASHINGTON U.-ST. LOUIS
WESTERN
WISCONSIN
YALE
YORK
Notes Total Library
Materials
7
Total Salaries
and Wages
8
Other
Operating
Expenditures
9
Total Library
Expenditures
6
Bibl. Utilities,
Networks, etc.
External
Expenditures
12
+-See Footnotes
.-Unavailable, not applicable or no data supplied
b -Basis of volume count is bibliographic
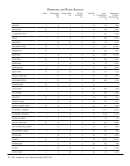
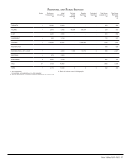
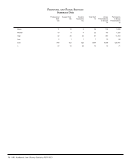
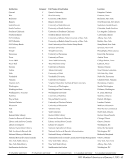