Data Tables 2012–2013 · 11
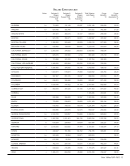
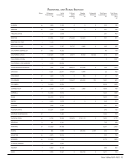
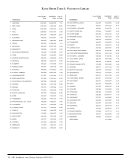
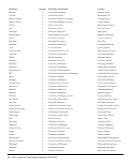
Collections and Collection Expenditures
+
+
+
+
+
+
b
b+
+
.
182,635
145,479
240,835
266,864
.
249,822
61,364
.
705,779
263,226
232,962
356,216
242,130
508,208
596,925
473,028
485,468
139,892
.
1,296,662
745,020
10,292
21,813
0
60,579
32,934
.
60,616
.
2
.
351,506
103,583
84,019
650,362
165,985
223,304
101,414
203,620
130,386
76,587
1,591,461
312,832
1,028,052
975,305
220,766
1,344,338
1,267,165
1,129,054
725,170
1,086,191
1,053,738
1,827,824
600,725
9,807
181,880
19,647
23,442
26,172
49,647
0
12,735
10,159
63,804
29,882
1,141,441
1,241,204
890,775
1,533,765
1,516,641
1,280,115
928,790
1,229,312
1,140,484
3,483,089
943,438
TORONTO
TULANE
UTAH
VANDERBILT
VIRGINIA
WASHINGTON
WASHINGTON U.-ST. LOUIS
WESTERN
WISCONSIN
YALE
YORK
Notes Titles Held
1
Volumes In
Library
2
Electronic
Books
4
One-time
resource
purchases
7a
Ongoing
resource
purchases
7b
Collection
Support
7c
Total
Library
Materials
7
+-See Footnotes
.-Unavailable, not applicable or no data supplied
b -Basis of volume count is bibliographic
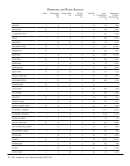
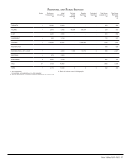
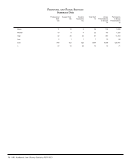
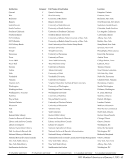