Data Tables 2012–2013 · 15
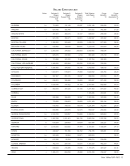
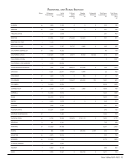
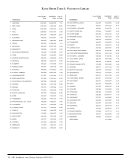
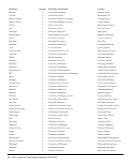
Salary Expenditures
+
+
+
+
+
+
b
b+
+
617,968
575,877
434,739
474,392
1,210,378
1,653,705
672,192
242,172
888,289
1,529,160
701,981
440,652
251,392
231,243
336,496
492,785
414,698
237,869
159,008
284,022
898,738
706,026
64,407
52,253
90,460
29,295
80,649
110,295
47,640
6,465
137,670
56,800
56,227
1,123,027
879,522
756,442
840,183
1,783,812
2,178,698
957,701
407,645
1,309,981
2,484,698
1,464,235
268,450
189,481
291,378
211,265
454,783
540,345
306,449
111,135
394,232
905,850
314,321
24.75
21.00
37.00
27.00
26.30
34.00
30.00
27.50
.
28.90
.
TORONTO
TULANE
UTAH
VANDERBILT
VIRGINIA
WASHINGTON
WASHINGTON U.-ST. LOUIS
WESTERN
WISCONSIN
YALE
YORK
Notes Salaries &
Wages
Professional
Staff
8a
Salaries &
Wages
Support Staff
8b
Salaries &
Wages
Student
Assistants
8c
Total Salaries
and Wages
8
Fringe
Benefits
10
Fringe
Benefits -
designated %
11
+-See Footnotes
.-Unavailable, not applicable or no data supplied
b -Basis of volume count is bibliographic
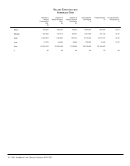
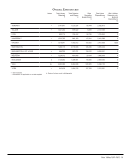
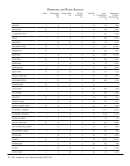
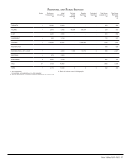
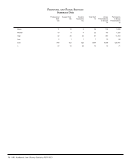
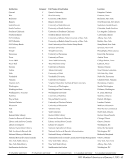