Data Tables · 25
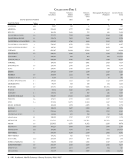
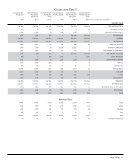
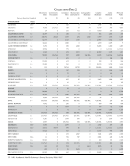
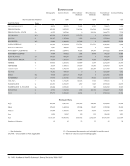
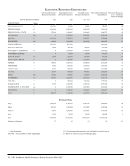
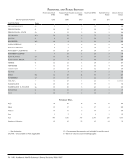
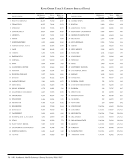
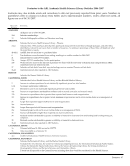
Personnel and Public Services
Library
Presentations to
Groups *
Participants
in Group
Presentations *
Reference
Transactions *
Initial
Circulation
Transactions
Total
Circulation
Transactions
Total Items
Loaned (ILL)
Total Items
Borrowed (ILL)
(29) (30) (31) (32) (33) (34) (35) (Survey Question Number)
INSTITUTION
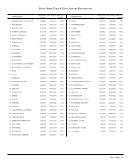
53 622 2,602 8,111 8,111 1,891 604 OKLAHOMA STATE
168 3,366 UA/NA 7,731 18,380 5,132 14,970 PENNSYLVANIA
38 832 9,844 18,571 19,578 3,057 1,033 PENNSYLVANIA STATE
744 8,216 58,553 30,297 35,077 37,241 4,344 PITTSBURGH
294 3,116 7,215 9,352 10,295 5,668 3,246 QUEENS
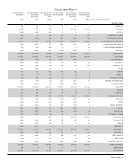
UA/NA UA/NA 6,343 5,080 7,022 5,595 5,794 ROCHESTER
237 2,572 4,068 22,637 31,132 4,863 5,769 SASKATCHEWAN
90 1,146 793 1,973 3,779 2,015 1,732 SOUTH CAROLINA
132 2,295 6,957 26,410 34,407 12,543 1,913 SOUTHERN CALIFORNIA
117 508 4,007 34,858 41,009 8,436 2,245 SOUTHERN ILLINOIS
97 2,347 12,260 16,882 33,203 12,345 5,422 SUNY-BUFFALO
297 2,559 14,879 4,881 7,041 9,132 1,594 SUNY-STONY BROOK
56 882 1,920 4,144 5,851 1,467 1,114 TEMPLE
279 4,100 17,113 3,329 4,181 6,207 3,665 TENNESSEE
512 3,826 21,236 34,139 91,013 5,440 3,741 TEXAS TECH
27 363 2,273 5,349 7,592 3,498 1,693 TULANE
376 3,676 58,062 12,798 15,288 15,032 6,196 UTAH
267 6,969 4,315 14,695 15,712 9,712 4,137 VANDERBILT
626 3,902 12,385 10,723 13,872 7,629 2,415 VIRGINIA
276 3,121 19,093 24,862 52,226 19,984 3,723 WASHINGTON
138 1,912 17,425 UA/NA 80,769 13,940 1,525 WASHINGTON U.-ST. LOUIS
457 5,064 UA/NA 11,562 19,708 9,227 19,072 WISCONSIN
808 4,538 13,599 UA/NA 23,596 10,648 6,426 YALE
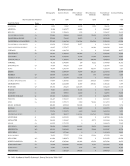
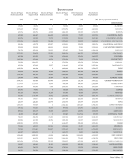
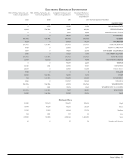
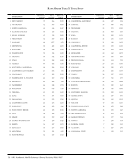
Summary Data
808 8,538 58,553 90,741 220,618 51,941 19,072 High
247 3,192 13,967 17,719 32,203 10,494 4,515 Mean
217 2,864 12,260 14,764 21,324 8,423 3,906 Median
17 199 793 261 337 98 100 Low
15,574 197,896 824,070 1,063,135 2,093,173 671,631 288,961 Sum
63 62 59 60 65 64 64 Number of Libraries
*Figures in italics are derived from a sampling method rather than an actual annual count.
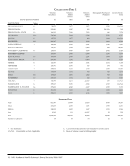
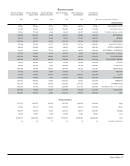
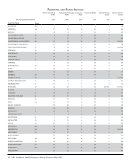
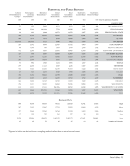
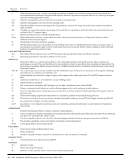
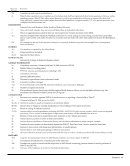
Personnel and Public Services
Library
Presentations to
Groups *
Participants
in Group
Presentations *
Reference
Transactions *
Initial
Circulation
Transactions
Total
Circulation
Transactions
Total Items
Loaned (ILL)
Total Items
Borrowed (ILL)
(29) (30) (31) (32) (33) (34) (35) (Survey Question Number)
INSTITUTION
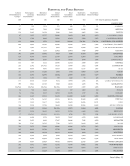
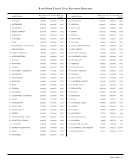
53 622 2,602 8,111 8,111 1,891 604 OKLAHOMA STATE
168 3,366 UA/NA 7,731 18,380 5,132 14,970 PENNSYLVANIA
38 832 9,844 18,571 19,578 3,057 1,033 PENNSYLVANIA STATE
744 8,216 58,553 30,297 35,077 37,241 4,344 PITTSBURGH
294 3,116 7,215 9,352 10,295 5,668 3,246 QUEENS
UA/NA UA/NA 6,343 5,080 7,022 5,595 5,794 ROCHESTER
237 2,572 4,068 22,637 31,132 4,863 5,769 SASKATCHEWAN
90 1,146 793 1,973 3,779 2,015 1,732 SOUTH CAROLINA
132 2,295 6,957 26,410 34,407 12,543 1,913 SOUTHERN CALIFORNIA
117 508 4,007 34,858 41,009 8,436 2,245 SOUTHERN ILLINOIS
97 2,347 12,260 16,882 33,203 12,345 5,422 SUNY-BUFFALO
297 2,559 14,879 4,881 7,041 9,132 1,594 SUNY-STONY BROOK
56 882 1,920 4,144 5,851 1,467 1,114 TEMPLE
279 4,100 17,113 3,329 4,181 6,207 3,665 TENNESSEE
512 3,826 21,236 34,139 91,013 5,440 3,741 TEXAS TECH
27 363 2,273 5,349 7,592 3,498 1,693 TULANE
376 3,676 58,062 12,798 15,288 15,032 6,196 UTAH
267 6,969 4,315 14,695 15,712 9,712 4,137 VANDERBILT
626 3,902 12,385 10,723 13,872 7,629 2,415 VIRGINIA
276 3,121 19,093 24,862 52,226 19,984 3,723 WASHINGTON
138 1,912 17,425 UA/NA 80,769 13,940 1,525 WASHINGTON U.-ST. LOUIS
457 5,064 UA/NA 11,562 19,708 9,227 19,072 WISCONSIN
808 4,538 13,599 UA/NA 23,596 10,648 6,426 YALE
Summary Data
808 8,538 58,553 90,741 220,618 51,941 19,072 High
247 3,192 13,967 17,719 32,203 10,494 4,515 Mean
217 2,864 12,260 14,764 21,324 8,423 3,906 Median
17 199 793 261 337 98 100 Low
15,574 197,896 824,070 1,063,135 2,093,173 671,631 288,961 Sum
63 62 59 60 65 64 64 Number of Libraries
*Figures in italics are derived from a sampling method rather than an actual annual count.