Highlights: ARL Academic Health Sciences Library Statistics 2010–2011 · 5
Highlights: ARL Academic Health Sciences Library Statistics 2010–2011
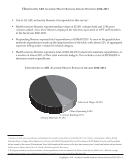
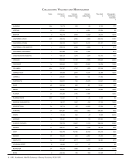
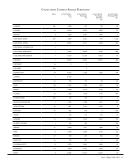
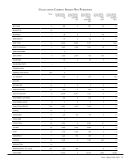
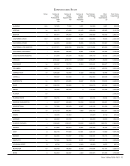
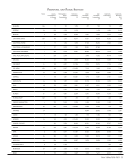
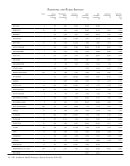
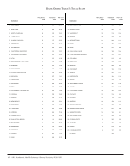
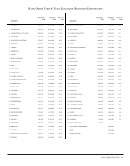
• Out of 115 ARL university libraries, 63 responded to this survey.1
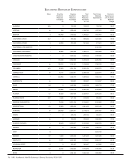
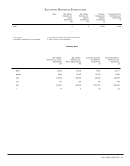
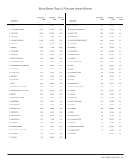
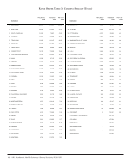
• Health sciences libraries reported median values of 217,811 volumes held and 1,740 gross
volumes added. Also, these libraries employed the full-time equivalent of 1,977 staff members
in the fiscal year 2010–2011.
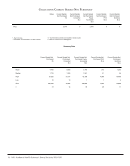
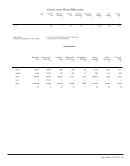
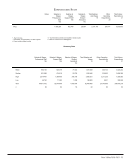
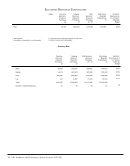
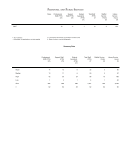
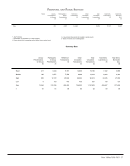
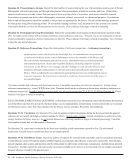
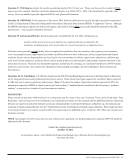
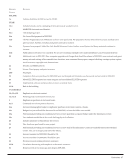
• Responding libraries reported total expenditures of $240,675,218.2 As seen in the graph below,
materials expenditures made up the largest portion of the total, with almost 52% of aggregated
expenses falling under a materials-related category.
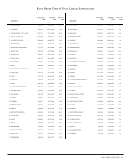
• Health sciences libraries reported a total of $101,124,356 in electronic materials expenditures, or
a median of almost 89% of their total materials budgets. This includes a total of $97,504,002 in
electronic serials expenditures.
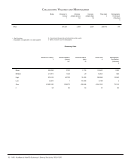
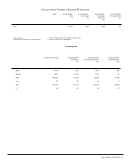
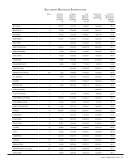
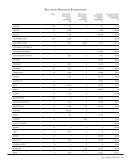
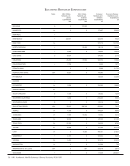
Expenditures in ARL Academic Health Sciences Libraries 2010–2011
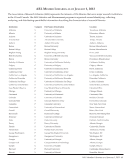
1 Seventy-six ARL university libraries included data for a health sciences library in the 2010–2011 ARL Statistics. Among them, Alberta, British
Columbia, Brown, Calgary, Johns Hopkins, Laval, Louisville, McGill, Manitoba, Missouri, Ohio, Ottawa, SUNY-Buffalo, Toronto, and Wayne State
did not complete this survey. Pittsburgh and Texas A&M completed this survey for the first time in many years. Cornell and Indiana did not include
health sciences library data in the ARL Statistics, but did respond to this survey.
2 This figure includes Canadian universities, whose expenditures were converted to U.S. dollars at the rate of 1.0014 Can $=1 US$, the average
monthly noon exchange rate published in the Bank of Canada Review for the period July 2010–June 2011.
Contract Binding 0.17%
Other Operating 9.62%
Salaries &Wages 38.43%
Library Materials 51.78%
Highlights: ARL Academic Health Sciences Library Statistics 2010–2011
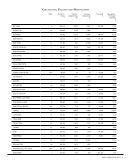
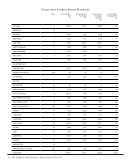
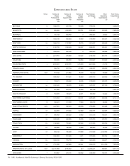
• Out of 115 ARL university libraries, 63 responded to this survey.1
• Health sciences libraries reported median values of 217,811 volumes held and 1,740 gross
volumes added. Also, these libraries employed the full-time equivalent of 1,977 staff members
in the fiscal year 2010–2011.
• Responding libraries reported total expenditures of $240,675,218.2 As seen in the graph below,
materials expenditures made up the largest portion of the total, with almost 52% of aggregated
expenses falling under a materials-related category.
• Health sciences libraries reported a total of $101,124,356 in electronic materials expenditures, or
a median of almost 89% of their total materials budgets. This includes a total of $97,504,002 in
electronic serials expenditures.
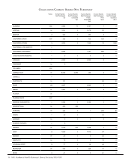
Expenditures in ARL Academic Health Sciences Libraries 2010–2011
1 Seventy-six ARL university libraries included data for a health sciences library in the 2010–2011 ARL Statistics. Among them, Alberta, British
Columbia, Brown, Calgary, Johns Hopkins, Laval, Louisville, McGill, Manitoba, Missouri, Ohio, Ottawa, SUNY-Buffalo, Toronto, and Wayne State
did not complete this survey. Pittsburgh and Texas A&M completed this survey for the first time in many years. Cornell and Indiana did not include
health sciences library data in the ARL Statistics, but did respond to this survey.
2 This figure includes Canadian universities, whose expenditures were converted to U.S. dollars at the rate of 1.0014 Can $=1 US$, the average
monthly noon exchange rate published in the Bank of Canada Review for the period July 2010–June 2011.
Contract Binding 0.17%
Other Operating 9.62%
Salaries &Wages 38.43%
Library Materials 51.78%