Document Details
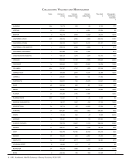
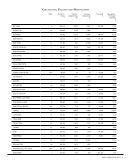
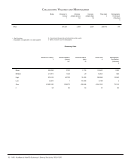
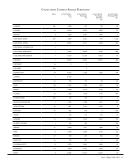
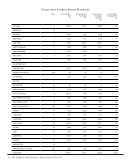
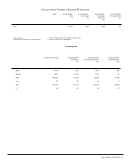
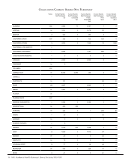
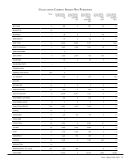
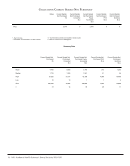
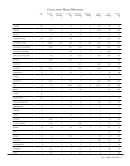
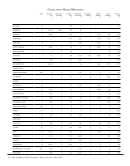
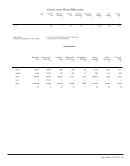
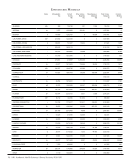
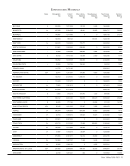
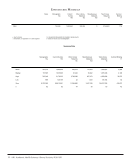
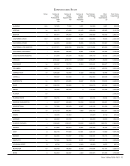
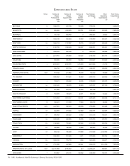
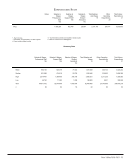
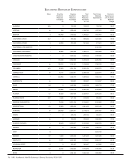
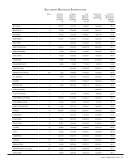
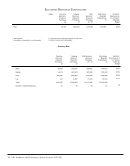
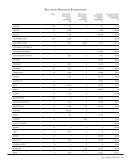
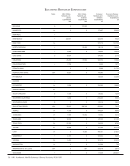
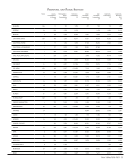
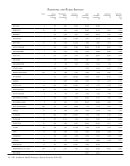
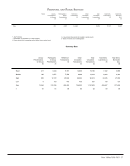
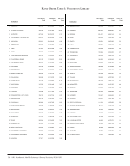
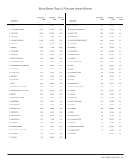
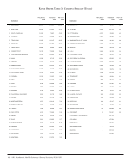
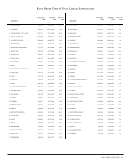
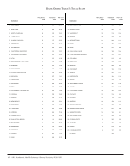
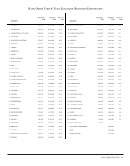
ARL Academic Health Sciences Library Statistics 2010-2011
Page
4
(
4
of
72
)
GO
Previous Page
Next Page
ARL Academic Health Sciences Library Statistics 2010-2011 resources
Download PDF
ARL Academic Health Sciences Library Statistics 2010-2011 (72)
Download PDF
ARL Academic Health Sciences Library Statistics 2010–2011 frontmatter (4)
Help
Close
This book
2023 Internal: ARL Statistics Back Issues
Academic Health Library Statistics
ARL Statistics
Publications by Roebuck, Gary
Publications by Kyrillidou, Martha
Publications by Morris, Shaneka
Publications by Some Author
All books
GO
Zoom In
Zoom Out
Contents
Resources
Extract
Help
Printable
Destination page number
Search scope
Search Text