
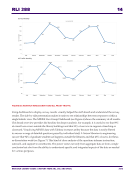
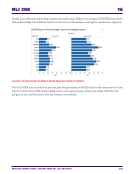
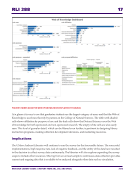
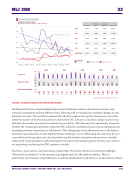
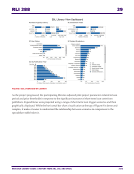
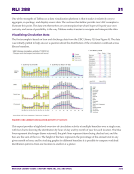
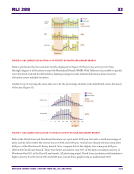
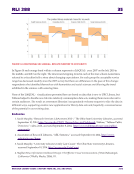
RLI 288 32 RESEARCH LIBRARY ISSUES: A REPORT FROM ARL, CNI, AND SPARC 2016 FIGURE 10. UBC LIBRARY CIRCULATION: % OF ACTIVITY BY MONTH AND LIBRARY BRANCH Note in particular the four summer months displayed in Figure 10: there is less activity from May through August at all locations except the Biomedical Branch (BMB). With Tableau it is possible to quickly view this level of detail for all branches, helping managers make informed decisions about resource allocation across multiple locations. Another way of viewing the same data set is by the percentage of daily work distributed across the hours of the day (Figure 11). FIGURE 11. UBC LIBRARY CIRCULATION: % OF DAILY ACTIVITY BY HOUR AND LIBRARY BRANCH Both of the David Lam and Woodward locations are open until 10:00 p.m. but only a small percentage of daily activity falls within the service hours of 6:00 and 10:00 p.m. Notice how sharply the bars drop after 6:00 p.m. at the Woodward Library branch. Now compare this to the slightly less acute post-6:00 p.m. shift at the David Lam branch. Those four hours account for only 10% of the daily circulation activity at Woodward but 16% at the David Lam branch. All else being equal, David Lam circulation staff maintain a higher activity level between 6:00 and 10:00 p.m., but do these graphs help us understand why?
Research Library Issues, no. 288 (2016) Page 32 (32 of 37)


Powered by Tizra® |
Research Library Issues, no. 288 (2016) resources
Free Attachments
Extracted Text (may have errors)
RLI 288 32 RESEARCH LIBRARY ISSUES: A REPORT FROM ARL, CNI, AND SPARC 2016 FIGURE 10. UBC LIBRARY CIRCULATION: % OF ACTIVITY BY MONTH AND LIBRARY BRANCH Note in particular the four summer months displayed in Figure 10: there is less activity from May through August at all locations except the Biomedical Branch (BMB). With Tableau it is possible to quickly view this level of detail for all branches, helping managers make informed decisions about resource allocation across multiple locations. Another way of viewing the same data set is by the percentage of daily work distributed across the hours of the day (Figure 11). FIGURE 11. UBC LIBRARY CIRCULATION: % OF DAILY ACTIVITY BY HOUR AND LIBRARY BRANCH Both of the David Lam and Woodward locations are open until 10:00 p.m. but only a small percentage of daily activity falls within the service hours of 6:00 and 10:00 p.m. Notice how sharply the bars drop after 6:00 p.m. at the Woodward Library branch. Now compare this to the slightly less acute post-6:00 p.m. shift at the David Lam branch. Those four hours account for only 10% of the daily circulation activity at Woodward but 16% at the David Lam branch. All else being equal, David Lam circulation staff maintain a higher activity level between 6:00 and 10:00 p.m., but do these graphs help us understand why?

