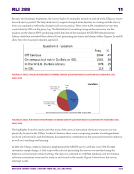
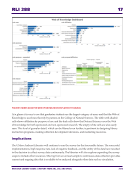
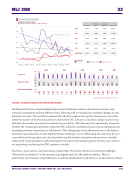
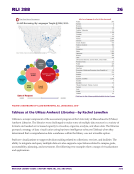
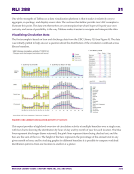
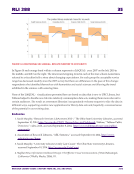
RLI 288 21 RESEARCH LIBRARY ISSUES: A REPORT FROM ARL, CNI, AND SPARC 2016 Tableau Unleashed: Visualizing Library Data Jeremy Buhler, Assessment Librarian, University of British Columbia Rachel Lewellen, Assessment Librarian, University of Massachusetts Amherst Sarah Anne Murphy, Coordinator of Assessment, The Ohio State University Libraries T ableau is rapid-analytics and data-visualization software that supports library assessment by enabling a library to query, explore, and visualize data in real time. Using Tableau, a library may produce flexible, in-depth, online dashboards, complete with filters and annotations to both customize visualizations and provide context. A library may also blend data from disparate sources to create dynamic, interactive graphics and reports. As we prepared our panel presentation for the 2014 Library Assessment Conference, we realized that Tableau’s value to academic libraries may best be demonstrated via show-and-tell. We used the following questions to guide our discussion: • Discuss how your library has incorporated Tableau into its assessment program. • What impact has Tableau had on your ability to make sense of large data sets, make data accessible, and improve stakeholder communications? • Where does Tableau fit in your library’s data strategy? Tableau at The Ohio State University Libraries—by Sarah Anne Murphy Tableau is a key tool used by The Ohio State University (OSU) Libraries assessment program. The software enhances the libraries’ ability to aggregate data and to assemble data from various library systems into meaningful packages for library decision makers. It is a key component of the libraries’ strategy to gather, process, and make data available to both the libraries’ internal and external stakeholders. I discovered Tableau in spring of 2012, and quickly realized its potential for not only analyzing and visualizing library data, but for gathering, repackaging, and delivering library data in a timely manner to inform decision making. Research Services Trends Figure 1 showcases a Research Services Trends dashboard that is updated quarterly for the OSU Libraries Research and Education division’s quarterly report. This dashboard is freely available to all OSU librarians and staff and was created using Tableau’s Desktop Personal software, a production tool that is currently discounted for educators. The dashboard was posted to the web via Tableau Public, a free service that allows users to share Tableau visualizations online.1
Help