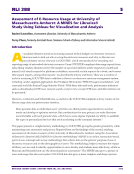
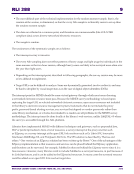
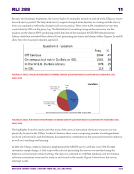
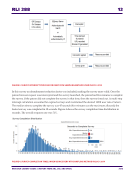
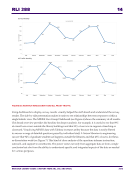
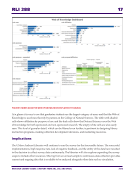
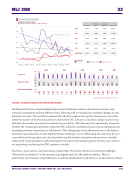
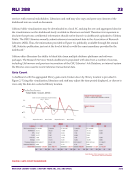
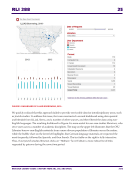
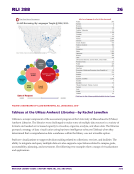
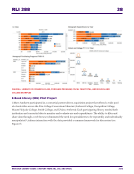
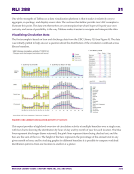
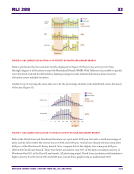
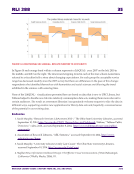
RLI 288 24 RESEARCH LIBRARY ISSUES: A REPORT FROM ARL, CNI, AND SPARC 2016 Thus, if we select Veterinary Medicine from the “Select Library” pull-down menu, only data for the Veterinary Medicine Library will display on the screen. The trend line will also recalculate using the data for the Veterinary Medicine Library only. ILLiad Borrowing, 2010– In the spring of 2013, the OSU Libraries assembled a five-member project team to explore the potential application of Tableau within the OSU Libraries. The Visualizing ILLiad team was co-led by the assessment coordinator and the head of interlibrary loan and included subject librarians from the Research Services and Area Studies departments. Together team members identified questions of interest to subject librarians that might be answered with ILLiad transactional data, and then built and tested two dashboards to allow subject librarians to interact with and understand borrowing trends for their assigned departments to better inform their collection activities. Questions included: • Who is borrowing what titles? How often? When? (Who includes patrons and institutions) • What are faculty affiliated with interdisciplinary centers borrowing? • Can graduate student borrowing be segmented by academic program? Figure 3 shows the aggregate number of patron borrowing requests for departments served by one of the OSU Libraries’ science librarians. The map on the top left of the screen shows that OSU primarily borrows materials from its Committee on Institutional Cooperation (CIC) partners for astronomy, chemistry, engineering, and physics students and faculty. The bars in the lower left visually segment borrowing requests by department, year, and month for 2012 and 2013. The “Format” text table on the lower right is fully interactive. If you click on “Book,” for example, a full list of titles borrowed during the time period specified is returned, broken down by user department.
Help