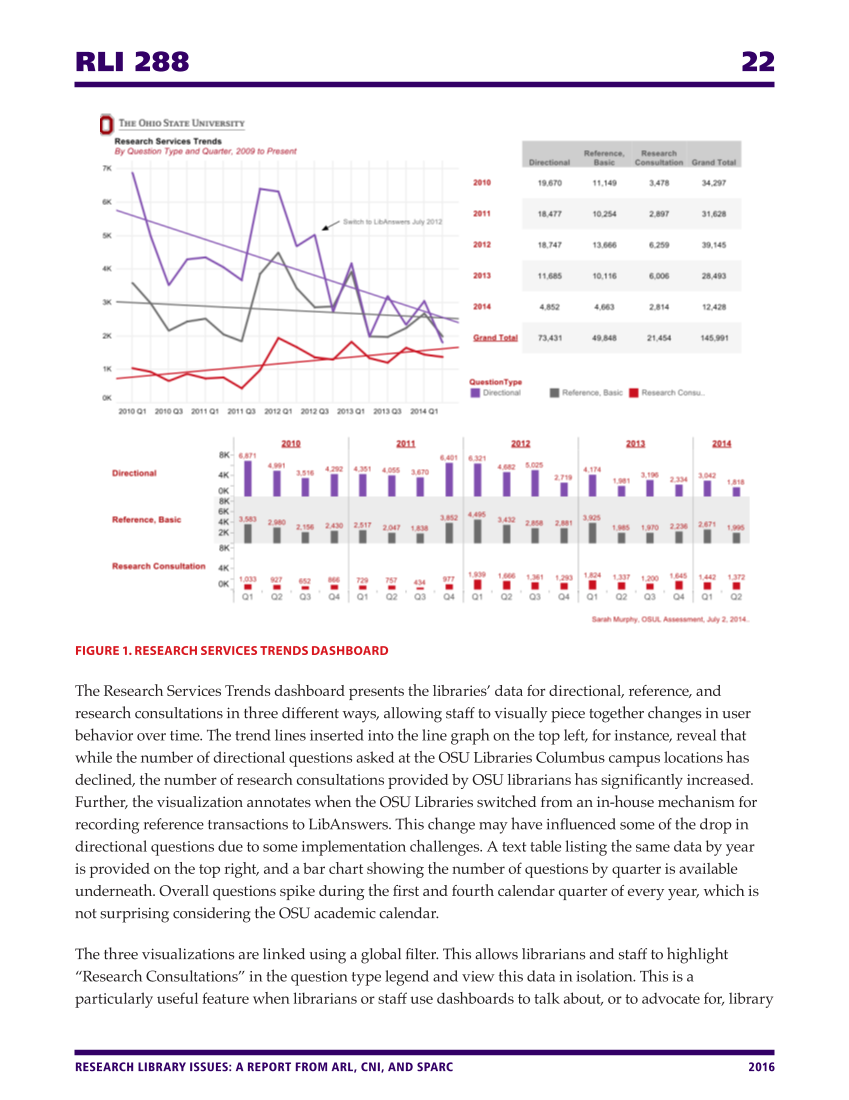
RLI 288 22 RESEARCH LIBRARY ISSUES: A REPORT FROM ARL, CNI, AND SPARC 2016 FIGURE 1. RESEARCH SERVICES TRENDS DASHBOARD The Research Services Trends dashboard presents the libraries’ data for directional, reference, and research consultations in three different ways, allowing staff to visually piece together changes in user behavior over time. The trend lines inserted into the line graph on the top left, for instance, reveal that while the number of directional questions asked at the OSU Libraries Columbus campus locations has declined, the number of research consultations provided by OSU librarians has significantly increased. Further, the visualization annotates when the OSU Libraries switched from an in-house mechanism for recording reference transactions to LibAnswers. This change may have influenced some of the drop in directional questions due to some implementation challenges. A text table listing the same data by year is provided on the top right, and a bar chart showing the number of questions by quarter is available underneath. Overall questions spike during the first and fourth calendar quarter of every year, which is not surprising considering the OSU academic calendar. The three visualizations are linked using a global filter. This allows librarians and staff to highlight “Research Consultations” in the question type legend and view this data in isolation. This is a particularly useful feature when librarians or staff use dashboards to talk about, or to advocate for, library
Help


