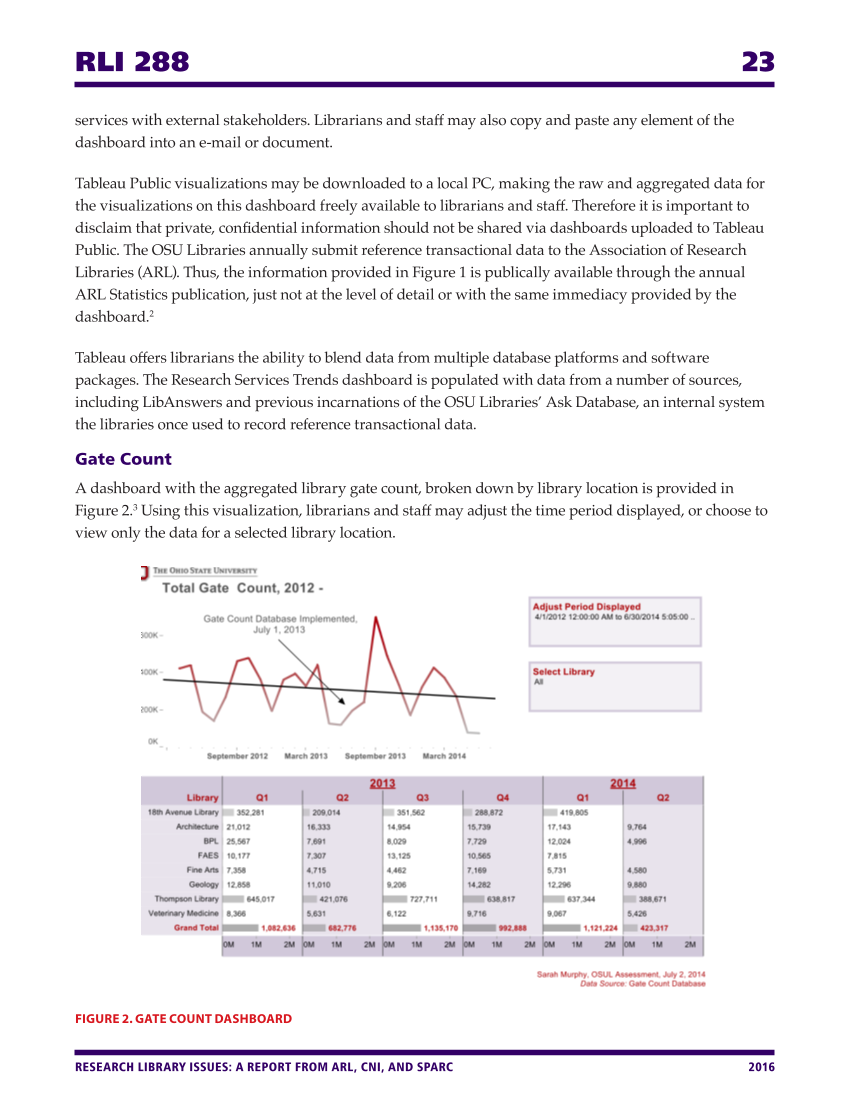
RLI 288 23 RESEARCH LIBRARY ISSUES: A REPORT FROM ARL, CNI, AND SPARC 2016 services with external stakeholders. Librarians and staff may also copy and paste any element of the dashboard into an e-mail or document. Tableau Public visualizations may be downloaded to a local PC, making the raw and aggregated data for the visualizations on this dashboard freely available to librarians and staff. Therefore it is important to disclaim that private, confidential information should not be shared via dashboards uploaded to Tableau Public. The OSU Libraries annually submit reference transactional data to the Association of Research Libraries (ARL). Thus, the information provided in Figure 1 is publically available through the annual ARL Statistics publication, just not at the level of detail or with the same immediacy provided by the dashboard.2 Tableau offers librarians the ability to blend data from multiple database platforms and software packages. The Research Services Trends dashboard is populated with data from a number of sources, including LibAnswers and previous incarnations of the OSU Libraries’ Ask Database, an internal system the libraries once used to record reference transactional data. Gate Count A dashboard with the aggregated library gate count, broken down by library location is provided in Figure 2.3 Using this visualization, librarians and staff may adjust the time period displayed, or choose to view only the data for a selected library location. FIGURE 2. GATE COUNT DASHBOARD
Help


