Data Tables 2008–2009 · 27
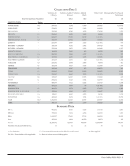
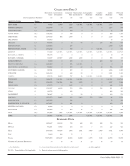
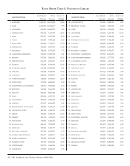
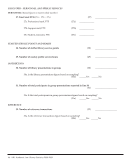
Personnel and Public Services
Library
Presentations
to Groups*
Participants
in Group
Presentations*
Reference
Transactions*
Initial Circulation
Transactions
Total Circulation
Transactions
Total Items
Loaned (ILL)
Total Items
Borrowed (ILL)
(30) (31) (32) (33) (34) (35) (36) (Survey Question Number)
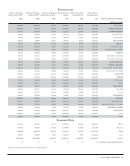
INSTITUTION
80 1,300 19,900 9,000 22,000 810 1,790 NEW YORK
174 3,073 4,872 4,603 9,305 619 655 NORTH CAROLINA
113 2,140 4,910 11,306 18,419 1,920 1,913 NORTHWESTERN
UA/NA UA/NA UA/NA 10,476 20,073 1,221 714 NOTRE DAME
171 1,064 4,105 10,602 48,150 316 135 OHIO STATE
430 974 1,333 3,195 3,627 107 323 OKLAHOMA
62 494 2,789 4,632 8,871 1,995 1,618 OREGON
238 5,404 UA/NA 9,516 21,427 724 1,251 PENNSYLVANIA
40 841 3,634 2,638 3,714 288 634 PENNSYLVANIA STATE
23 1,554 3,277 6,709 7,396 376 242 QUEEN'S
7 .1,837 2,364 5,244 94 259 RUTGERS -Camden
42 540 13,015 3,093 6,208 212 479 RUTGERS -Newark
26 842 1,779 5,290 8,177 224 35 SASKATCHEWAN
163 782 4,000 6,222 9,025 100 466 SOUTH CAROLINA
270 370 1,894 4,924 9,791 133 620 SOUTHERN CALIFORNIA
16 233 950 3,458 4,366 900 650 SOUTHERN ILLINOIS
86 1,313 9,279 3,359 5,984 305 383 SYRACUSE
79 1,522 23,002 5,046 8,738 26 632 TEMPLE
UA/NA UA/NA UA/NA UA/NA UA/NA 266 113 TENNESSEE
36 412 4,118 15,831 36,038 1,270 348 TEXAS
224 3,286 3,800 20,405 24,804 572 345 TEXAS TECH
67 1,131 7,550 3,434 4,269 289 551 TULANE
203 1,429 10,700 5,930 13,461 528 1,007 UTAH
27 2,222 1,645 3,476 6,357 104 655 VANDERBILT
34 480 11,860 34,403 52,195 1,365 1,418 VIRGINIA
184 2,339 ..26,756 1,524 1,133 WASHINGTON
274 887 .6,838 11,786 561 1,549 WASHINGTON U.-ST. LOUIS
44 208 1,775 7,221 9,248 UA/NA UA/NA WESTERN ONTARIO
55 470 6,340 7,637 12,647 405 830 WISCONSIN
327 3,050 5,280 28,956 54,109 1,831 1,843 YALE
94 1,391 25,130 27,572 29,909 1,077 500 YORK
Summary Data
135 1,574 6,989 9,913 19,143 790 786 Mean
87 1,066 4,872 6,709 11,761 516 626 Median
711 8,195 27,650 43,342 157,847 5,661 3,464 High
7 104 950 979 1,253 26 32 Low
9,161 105,440 454,305 683,972 1,359,129 55,302 55,015 Totals
68 67 65 69 71 70 70 Number of Libraries Reporting
*Figures in italics are derived from a sampling method rather than an actual annual count.
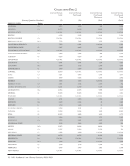
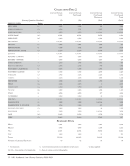
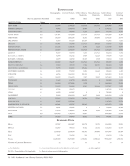
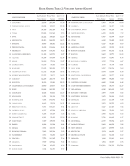
Personnel and Public Services
Library
Presentations
to Groups*
Participants
in Group
Presentations*
Reference
Transactions*
Initial Circulation
Transactions
Total Circulation
Transactions
Total Items
Loaned (ILL)
Total Items
Borrowed (ILL)
(30) (31) (32) (33) (34) (35) (36) (Survey Question Number)
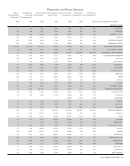
INSTITUTION
80 1,300 19,900 9,000 22,000 810 1,790 NEW YORK
174 3,073 4,872 4,603 9,305 619 655 NORTH CAROLINA
113 2,140 4,910 11,306 18,419 1,920 1,913 NORTHWESTERN
UA/NA UA/NA UA/NA 10,476 20,073 1,221 714 NOTRE DAME
171 1,064 4,105 10,602 48,150 316 135 OHIO STATE
430 974 1,333 3,195 3,627 107 323 OKLAHOMA
62 494 2,789 4,632 8,871 1,995 1,618 OREGON
238 5,404 UA/NA 9,516 21,427 724 1,251 PENNSYLVANIA
40 841 3,634 2,638 3,714 288 634 PENNSYLVANIA STATE
23 1,554 3,277 6,709 7,396 376 242 QUEEN'S
7 .1,837 2,364 5,244 94 259 RUTGERS -Camden
42 540 13,015 3,093 6,208 212 479 RUTGERS -Newark
26 842 1,779 5,290 8,177 224 35 SASKATCHEWAN
163 782 4,000 6,222 9,025 100 466 SOUTH CAROLINA
270 370 1,894 4,924 9,791 133 620 SOUTHERN CALIFORNIA
16 233 950 3,458 4,366 900 650 SOUTHERN ILLINOIS
86 1,313 9,279 3,359 5,984 305 383 SYRACUSE
79 1,522 23,002 5,046 8,738 26 632 TEMPLE
UA/NA UA/NA UA/NA UA/NA UA/NA 266 113 TENNESSEE
36 412 4,118 15,831 36,038 1,270 348 TEXAS
224 3,286 3,800 20,405 24,804 572 345 TEXAS TECH
67 1,131 7,550 3,434 4,269 289 551 TULANE
203 1,429 10,700 5,930 13,461 528 1,007 UTAH
27 2,222 1,645 3,476 6,357 104 655 VANDERBILT
34 480 11,860 34,403 52,195 1,365 1,418 VIRGINIA
184 2,339 ..26,756 1,524 1,133 WASHINGTON
274 887 .6,838 11,786 561 1,549 WASHINGTON U.-ST. LOUIS
44 208 1,775 7,221 9,248 UA/NA UA/NA WESTERN ONTARIO
55 470 6,340 7,637 12,647 405 830 WISCONSIN
327 3,050 5,280 28,956 54,109 1,831 1,843 YALE
94 1,391 25,130 27,572 29,909 1,077 500 YORK
Summary Data
135 1,574 6,989 9,913 19,143 790 786 Mean
87 1,066 4,872 6,709 11,761 516 626 Median
711 8,195 27,650 43,342 157,847 5,661 3,464 High
7 104 950 979 1,253 26 32 Low
9,161 105,440 454,305 683,972 1,359,129 55,302 55,015 Totals
68 67 65 69 71 70 70 Number of Libraries Reporting
*Figures in italics are derived from a sampling method rather than an actual annual count.