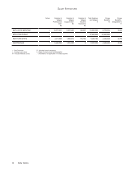
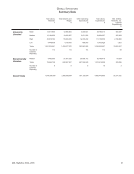
81 ARL Statistics 2014–2015
Question Number Footnote
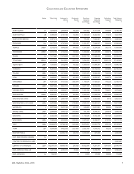
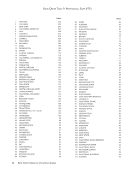
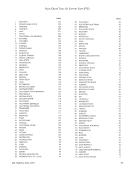
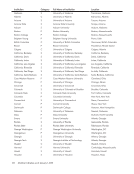
CINCINNATI cont.
23 All libraries have not kept a gate count during 2014–15, so this is only a partial number of the
total.
25 2015 results were reported according to IPEDS completions. 2014 results were duplicated as a
result of UC offering multiple degrees under one CIP code.
26 Prior to 2015, only AAUP faculty were reported in faculty reports.
COLORADO
All figures are as of 06/30/2015.
Library branches included: Main Music Engineering, Mathematics, and Physics Earth
Sciences and Maps and Business.
Library branches NOT included: Law library is reported separately.
4 Purchased large sets of e-book backfiles.
7 Received one-time supplemental allocation from the campus.
8.a, 10 Professional salaries and total benefits are more than 10% over FY14 because we hired or
promoted seven employees into professional positions during FY2015.
23 Overnight (Commons) patrons do not pass through a gate, so this data is not included in the
total. One branch had a gate malfunction, so a portion of their data was collected by head counts.
COLORADO STATE
All figures are as of 06/30/2015.
12 This value was overstated in previous years, as values not just paid by the library were included.
This year we have corrected the amount of this question.
13.a Vacancies and one sub-department on the IT side was realigned mid-year to a different part of
the university.
22 No explanation in drop library is still a net lender.
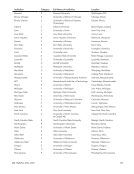
COLUMBIA
All figures are as of 08/31/2015. [Teachers College]
Library branches included: Columbia data includes The Columbia Center for New Media
Teaching and Learning (CCNMTL) and the Center for Digital Research and Scholarship
(CDRS). [Butler]
1 Excludes HathiTrust titles. [Butler]
2 Volumes Held as of June 30, 2014, for Columbia in total should have been 13,002,238. This
number is restated to eliminate double counting of items. [Butler]
21–22 Excludes ILL for Barnard handled by Butler office. [Barnard]
24–25 Included in Butler total. [Teachers College]
CONNECTICUT
All figures are as of 06/30/2015.
Library branches included: Avery Point, Greater Hartford, Stamford, Torrington, and
Waterbury.
11 Editor’s Note: Published figure reflects the official designated percent for the Health Sciences
Library (67%), as this is the maximum value entered for this question.
24–26 According to the 2015 Fact Sheet
CORNELL
All figures are as of 06/30/2015.
Question Number Footnote
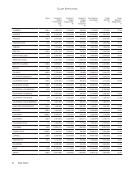
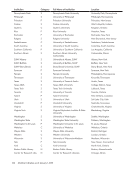
CINCINNATI cont.
23 All libraries have not kept a gate count during 2014–15, so this is only a partial number of the
total.
25 2015 results were reported according to IPEDS completions. 2014 results were duplicated as a
result of UC offering multiple degrees under one CIP code.
26 Prior to 2015, only AAUP faculty were reported in faculty reports.
COLORADO
All figures are as of 06/30/2015.
Library branches included: Main Music Engineering, Mathematics, and Physics Earth
Sciences and Maps and Business.
Library branches NOT included: Law library is reported separately.
4 Purchased large sets of e-book backfiles.
7 Received one-time supplemental allocation from the campus.
8.a, 10 Professional salaries and total benefits are more than 10% over FY14 because we hired or
promoted seven employees into professional positions during FY2015.
23 Overnight (Commons) patrons do not pass through a gate, so this data is not included in the
total. One branch had a gate malfunction, so a portion of their data was collected by head counts.
COLORADO STATE
All figures are as of 06/30/2015.
12 This value was overstated in previous years, as values not just paid by the library were included.
This year we have corrected the amount of this question.
13.a Vacancies and one sub-department on the IT side was realigned mid-year to a different part of
the university.
22 No explanation in drop library is still a net lender.
COLUMBIA
All figures are as of 08/31/2015. [Teachers College]
Library branches included: Columbia data includes The Columbia Center for New Media
Teaching and Learning (CCNMTL) and the Center for Digital Research and Scholarship
(CDRS). [Butler]
1 Excludes HathiTrust titles. [Butler]
2 Volumes Held as of June 30, 2014, for Columbia in total should have been 13,002,238. This
number is restated to eliminate double counting of items. [Butler]
21–22 Excludes ILL for Barnard handled by Butler office. [Barnard]
24–25 Included in Butler total. [Teachers College]
CONNECTICUT
All figures are as of 06/30/2015.
Library branches included: Avery Point, Greater Hartford, Stamford, Torrington, and
Waterbury.
11 Editor’s Note: Published figure reflects the official designated percent for the Health Sciences
Library (67%), as this is the maximum value entered for this question.
24–26 According to the 2015 Fact Sheet
CORNELL
All figures are as of 06/30/2015.