75 ARL Statistics 2014–2015
Question Number Footnote
BRIGHAM YOUNG cont.
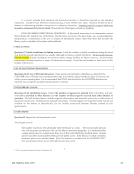
18 We discovered the 2013 successful full-text article request number was inflated due to a major
security breach into our databases. The figure being reported for 2013 was subsequently
normalized in order to more accurately reflect an estimate of “legitimate” full-text requests.
That 2013 figure should have been 2,534,701.
23 A computer failure during May and June of 2014 resulted in no counts during that period.
Estimates were made for those months to add to the recorded count to come up with a final
estimate of gate count for FY14.
BRITISH COLUMBIA
All figures are as of 03/31/2015.
Library branches included: Asian Library, Biomedical Branch Library, David Lam Library,
Dr. John Micallef Memorial Library (St. Mark’s College), Education Library, H.R. MacMillan
Library (Vancouver School of Theology), John Richard Allison Library (Regent College), Music,
Art and Architecture Library, Okanagan Library, Rare Books &Special Collections, Robson
Square Library, University Archives, Woodward Library, and Xwi7xwa Library (First Nations
House of Learning).
Data from the Law and Health Sciences Libraries are included in the figures reported.
4 Includes catalogued OA and free content accessible through library search interfaces.
6–9, 10, 12 Expenditures as reported in Canadian dollars — Collections Expenditures: (7a) $4,161,339
(7b) $13,773,210 (7c) $191,354 (7) $18,125,903 Salary Expenditures: (8a) $10,658,544
(8b) $6,186,408 (8c) $1,421,807 (8) $18,266,759 (10) $3,312,195 Overall Expenditures: (7)
$18,125,903 (8) $18,266,759 (9) $4,549,368 (6) $40,942,030 (12) NA/UA. NOTE: Total Salaries
and Wages (Q8) EXCLUDES Fringe Benefits Expenditures (Q10).
7.a Includes collections gifts in kind valued at 0.96M.
8.a Includes librarians and management and professional employee groups.
10 Includes fringe benefits for professional staff, support staff, and student assistants.
11 Official designated percentage for librarians. [Main Library] Editor’s Note: Published figure
reflects the official designated percent for the Law Library (55.35%), as this is the maximum
value entered for this question.
18 Successful article downloads from COUNTER JR1 and JR1A reports.
BROWN
All figures are as of 06/30/2015.
Library branches included: Includes Rockefeller Library, Sciences Library, John Hay Library,
Orwig Music Library, and Library Collections Annex. Also includes John Carter Brown Library
(separately funded, independent library on the Brown campus).
Medical library statistics cannot be disaggregated from the main because the medical collection
is an integral part of the Sciences Library.
4 Reflects increases and fluctuations in e-book packages.
7.a Includes end-of-year purchases.
7.c Decrease a result of pre-payments made in FY 2014.
9 Includes increase to security expenditures.
13.b Reflects JCB repurposing positions.
14 Reflects increased outreach activity.
16 Correction to FY 2014: 9,112.
18–19 Increase in number of databases providing COUNTER-compliant data better record keeping.
20 Reflects changes in search behavior since introduction of discovery search tool materials now
indexed in the discovery tool and fewer federated searches performed.
Question Number Footnote
BRIGHAM YOUNG cont.
18 We discovered the 2013 successful full-text article request number was inflated due to a major
security breach into our databases. The figure being reported for 2013 was subsequently
normalized in order to more accurately reflect an estimate of “legitimate” full-text requests.
That 2013 figure should have been 2,534,701.
23 A computer failure during May and June of 2014 resulted in no counts during that period.
Estimates were made for those months to add to the recorded count to come up with a final
estimate of gate count for FY14.
BRITISH COLUMBIA
All figures are as of 03/31/2015.
Library branches included: Asian Library, Biomedical Branch Library, David Lam Library,
Dr. John Micallef Memorial Library (St. Mark’s College), Education Library, H.R. MacMillan
Library (Vancouver School of Theology), John Richard Allison Library (Regent College), Music,
Art and Architecture Library, Okanagan Library, Rare Books &Special Collections, Robson
Square Library, University Archives, Woodward Library, and Xwi7xwa Library (First Nations
House of Learning).
Data from the Law and Health Sciences Libraries are included in the figures reported.
4 Includes catalogued OA and free content accessible through library search interfaces.
6–9, 10, 12 Expenditures as reported in Canadian dollars — Collections Expenditures: (7a) $4,161,339
(7b) $13,773,210 (7c) $191,354 (7) $18,125,903 Salary Expenditures: (8a) $10,658,544
(8b) $6,186,408 (8c) $1,421,807 (8) $18,266,759 (10) $3,312,195 Overall Expenditures: (7)
$18,125,903 (8) $18,266,759 (9) $4,549,368 (6) $40,942,030 (12) NA/UA. NOTE: Total Salaries
and Wages (Q8) EXCLUDES Fringe Benefits Expenditures (Q10).
7.a Includes collections gifts in kind valued at 0.96M.
8.a Includes librarians and management and professional employee groups.
10 Includes fringe benefits for professional staff, support staff, and student assistants.
11 Official designated percentage for librarians. [Main Library] Editor’s Note: Published figure
reflects the official designated percent for the Law Library (55.35%), as this is the maximum
value entered for this question.
18 Successful article downloads from COUNTER JR1 and JR1A reports.
BROWN
All figures are as of 06/30/2015.
Library branches included: Includes Rockefeller Library, Sciences Library, John Hay Library,
Orwig Music Library, and Library Collections Annex. Also includes John Carter Brown Library
(separately funded, independent library on the Brown campus).
Medical library statistics cannot be disaggregated from the main because the medical collection
is an integral part of the Sciences Library.
4 Reflects increases and fluctuations in e-book packages.
7.a Includes end-of-year purchases.
7.c Decrease a result of pre-payments made in FY 2014.
9 Includes increase to security expenditures.
13.b Reflects JCB repurposing positions.
14 Reflects increased outreach activity.
16 Correction to FY 2014: 9,112.
18–19 Increase in number of databases providing COUNTER-compliant data better record keeping.
20 Reflects changes in search behavior since introduction of discovery search tool materials now
indexed in the discovery tool and fewer federated searches performed.