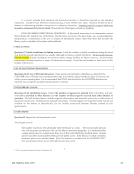
107 ARL Statistics 2014–2015
Question Number Footnote
2 ACLS Humanities – 3,859
DISCUS Credo Reference – 731
LLMC – 2,167
Loeb Classical Library – 183
Others – 9,500
4 Data collection for e-books changed this year. In order to report the products and number of
titles in Total Volumes Held, titles were pulled from individual products in opposed to pulling
the information from our ILS.
7 Library budget was increased during this fiscal year.
7.c OCLC and ILL costs increased compared to last year. FY15 binding costs -26,569 FY15 OCLC
costs -217,159 FY15 ILL costs -10,428.
8 Fringe benefits include: Health Insurance, Optional Dental Plus, Optional Vision Care, Life
Insurance, Disability Insurance, Workmen’s Compensation, and Retirement Plans. Three
professional staff positions were added.
11 Editor’s Note: Published figure reflects the official designated percent for the Health Sciences
Library (33%), as this is the maximum value entered for this question.
14–15 Number of bibliographic instruction sessions increased over the last fiscal year. Library-wide
discussion regarding what qualifies as a presentation to a group was initiated and helped to
increase reporting numbers.
16 Every service point location is being more diligent on recording reference transactions.
18 This is a trend that is increasing.
19–20 Number not able to be extracted from certain databases causing our number to decline.
23 Thomas Cooper Library utilizes a people counting software system. South Caroliniana Library
counts it’s visitors through log books. Moving Image Research Collections bases its gate count
on sampling. Music Library currently does not count visitors.
SOUTHERN CALIFORNIA
Library branches included: Main, Health Sciences, Special Collections, and Law.
Changes this year are due to the restructuring of our organization, new data tracking systems,
and adherence to ARL reporting rules for degrees and phasing out of federated searching.
2 We began using an electronic system to gather data rather than a physical count.
6 Campus-wide FY14 figure for Total Library Expenditures revised to 45,316,828. Campus-wide
figure for FY15 increased 0.3% by comparison.
7 Campus-wide FY14 figure for Total Library Materials Expenditures revised to 22,461,080.
Campus-wide figure for FY15 decreased -10.5% by comparison.
7.a One time purchases in FY2014 caused significant change for FY2015. Campus-wide FY14
figure for One-Time Resource Expenditures revised to 4,960,431. Campus-wide figure for FY15
decreased -35.9% by comparison.
7.c One time purchases in 7a accounts for decrease.
8–8.b, 10 Restructuring of organization accounts for significant change.
8 Campus-wide FY14 figure for Total Salaries and Wages revised to 18,801,924. Campus-wide
figure for FY15 decreased -0.4% by comparison.
8.a Campus-wide FY14 figure for Salaries and Wages for Professional Staff revised to 11,364,259.
8.b Campus-wide FY14 figure for Salaries and Wages for Support Professional Staff revised to
5,667,205. Campus-wide figure for FY15 increased 7% by comparison.
8.c Campus-wide FY14 figure for Salaries and Wages for Student Assistants revised to 1,770,460.
Campus-wide figure for FY15 decreased -7.6% by comparison.