Data Tables 2013–2014 · 29
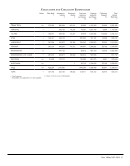
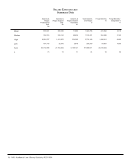
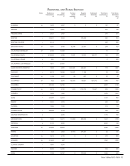
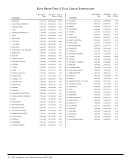
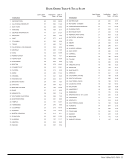
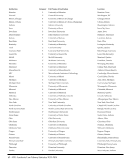
Personnel and Public Services
Summary Data
Summary Data
Mean
Median
High
Low
Sum
n
4,023
2,894
20,269
279
289,641
72
8,192
5,176
48,438
387
597,986
73
146,682
45,480
1,321,031
68
2,200,224
15
379,591
194,406
1,746,739
687
6,073,450
16
397,403
148,377
958,675
10,867
1,987,017
5
783
469
9,020
22
52,486
67
670
498
5,581
25
46,254
69
U
Reference
Transactions
16
Initial
Circulations
17
Full-text article
requests
18
Regular
Searches
19
Federated
Searches
20
Total Items
Loaned (ILL)
21
Total Items
Borrowed (ILL)
22
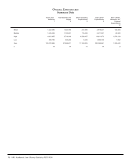
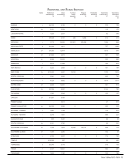
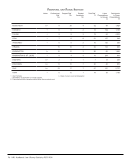
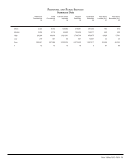