Data Tables 2013–2014 · 19
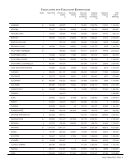
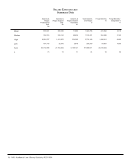
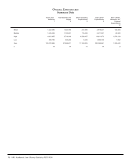
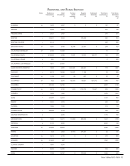
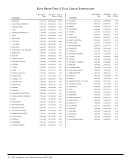
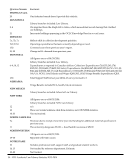
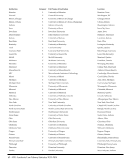
Overall Expenditures
b+
+
+
+
+
b
+
b+
b+
b+
+
1,256,162
1,110,048
1,234,413
834,618
1,513,890
1,509,360
1,055,709
671,712
970,629
1,208,874
3,396,973
944,813
1,263,050
1,027,472
830,218
777,416
880,379
1,781,089
1,801,767
960,736
330,240
1,374,685
2,810,651
1,314,126
505,839
115,438
6,435
31,144
117,311
162,846
140,936
100,320
128,052
90,656
553,885
96,002
3,025,051
2,252,958
2,071,066
1,643,178
2,511,580
3,453,295
2,998,412
1,732,768
1,428,920
2,674,215
6,761,509
2,354,941
0
.
0
.
0
1,982
0
.
0
0
0
0
TEXAS TECH
TORONTO
TULANE
UTAH
VANDERBILT
VIRGINIA
WASHINGTON
WASHINGTON U.-ST. LOUIS
WESTERN
WISCONSIN
YALE
YORK
Notes Total Library
Materials
7
Total Salaries
and Wages
8
Other
Operating
Expenditures
9
Total Library
Expenditures
6
Bibl. Utilities,
Networks, etc.
External
Expenditures
12
+-See Footnotes
.-Unavailable, not applicable or no data supplied
b -Basis of volume count is bibliographic
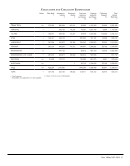
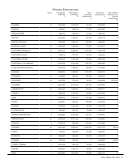
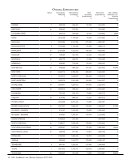
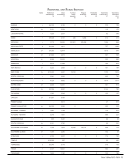
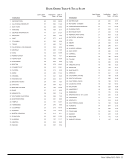
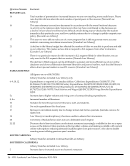