Data Tables 2013–2014 · 11
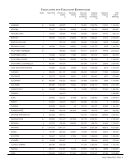
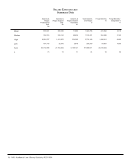
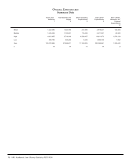
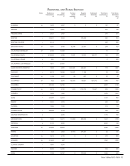
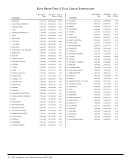
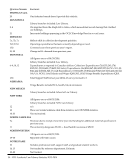
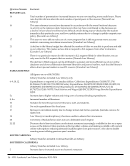
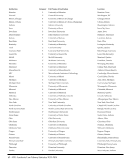
Collections and Collection Expenditures
b+
+
+
+
+
b
+
b+
b+
b+
+
574,383
.
185,871
146,141
247,694
287,216
.
257,273
61,826
.
720,264
337,156
660,264
235,125
399,750
244,116
518,977
599,207
491,122
493,917
123,710
.
1,316,080
832,155
416,811
10,202
53,201
.
65,356
33,312
.
65,940
.
1
.
99,082
88,895
79,257
87,979
657,033
224,342
196,951
58,012
164,212
120,089
83,718
1,440,296
215,511
1,103,569
1,021,705
1,027,866
161,197
1,260,523
1,288,227
981,319
507,500
841,973
1,100,028
1,890,596
675,732
63,698
9,086
118,568
16,388
29,025
24,182
16,378
.
8,567
25,128
66,081
53,570
1,256,162
1,110,048
1,234,413
834,618
1,513,890
1,509,360
1,055,709
671,712
970,629
1,208,874
3,396,973
944,813
TEXAS TECH
TORONTO
TULANE
UTAH
VANDERBILT
VIRGINIA
WASHINGTON
WASHINGTON U.-ST. LOUIS
WESTERN
WISCONSIN
YALE
YORK
Notes Titles Held
1
Volumes In
Library
2
Electronic
Books
4
One-time
resource
purchases
7a
Ongoing
resource
purchases
7b
Collection
Support
7c
Total
Library
Materials
7
+-See Footnotes
.-Unavailable, not applicable or no data supplied
b -Basis of volume count is bibliographic
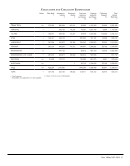
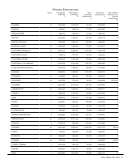
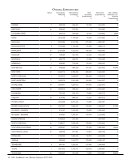
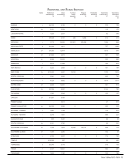
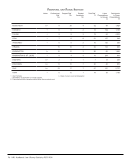
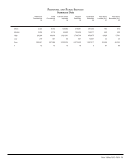
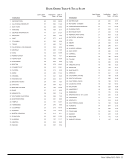
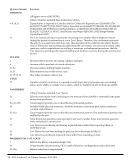
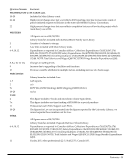