Data Tables 2013–2014 · 15
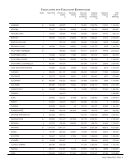
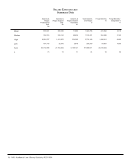
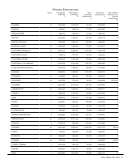
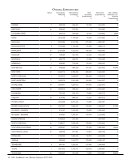
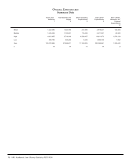
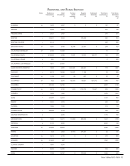
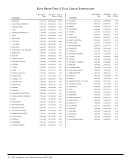
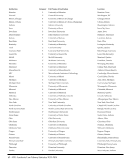
Salary Expenditures
b+
+
+
+
+
b
+
b+
b+
b+
+
448,699
600,946
550,219
475,571
522,096
1,223,360
1,309,095
693,648
167,718
928,173
1,821,007
664,049
728,974
337,422
239,121
210,226
326,144
479,192
418,812
215,616
154,409
319,458
911,606
590,899
85,377
89,104
40,878
91,619
32,139
78,537
73,860
51,472
8,113
127,054
78,038
59,177
1,263,050
1,027,472
830,218
777,416
880,379
1,781,089
1,801,767
960,736
330,240
1,374,685
2,810,651
1,314,126
374,546
241,009
173,984
287,555
216,615
434,629
541,041
298,278
89,412
461,685
995,265
290,843
18.00
24.75
19.80
37.00
26.00
24.90
.
.
27.50
.
29.40
.
TEXAS TECH
TORONTO
TULANE
UTAH
VANDERBILT
VIRGINIA
WASHINGTON
WASHINGTON U.-ST. LOUIS
WESTERN
WISCONSIN
YALE
YORK
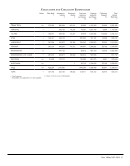
Notes Salaries &
Wages
Professional
Staff
8a
Salaries &
Wages
Support Staff
8b
Salaries &
Wages
Student
Assistants
8c
Total Salaries
and Wages
8
Fringe
Benefits
10
Fringe
Benefits -
designated %
11
+-See Footnotes
.-Unavailable, not applicable or no data supplied
b -Basis of volume count is bibliographic
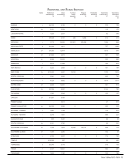
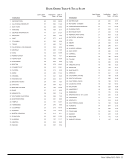
Salary Expenditures
b+
+
+
+
+
b
+
b+
b+
b+
+
448,699
600,946
550,219
475,571
522,096
1,223,360
1,309,095
693,648
167,718
928,173
1,821,007
664,049
728,974
337,422
239,121
210,226
326,144
479,192
418,812
215,616
154,409
319,458
911,606
590,899
85,377
89,104
40,878
91,619
32,139
78,537
73,860
51,472
8,113
127,054
78,038
59,177
1,263,050
1,027,472
830,218
777,416
880,379
1,781,089
1,801,767
960,736
330,240
1,374,685
2,810,651
1,314,126
374,546
241,009
173,984
287,555
216,615
434,629
541,041
298,278
89,412
461,685
995,265
290,843
18.00
24.75
19.80
37.00
26.00
24.90
.
.
27.50
.
29.40
.
TEXAS TECH
TORONTO
TULANE
UTAH
VANDERBILT
VIRGINIA
WASHINGTON
WASHINGTON U.-ST. LOUIS
WESTERN
WISCONSIN
YALE
YORK
Notes Salaries &
Wages
Professional
Staff
8a
Salaries &
Wages
Support Staff
8b
Salaries &
Wages
Student
Assistants
8c
Total Salaries
and Wages
8
Fringe
Benefits
10
Fringe
Benefits -
designated %
11
+-See Footnotes
.-Unavailable, not applicable or no data supplied
b -Basis of volume count is bibliographic