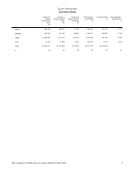
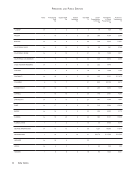
21 ARL Academic Health Sciences Library Statistics 2014–2015
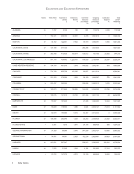
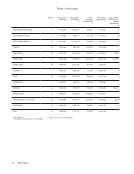
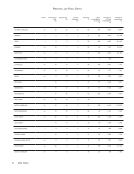
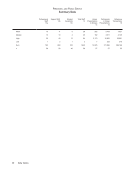
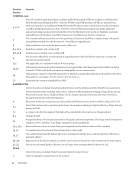
Personnel and Public Service
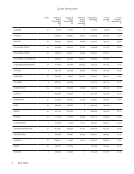
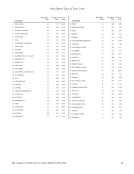
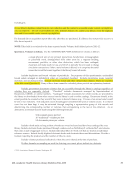
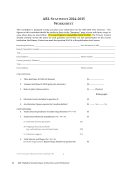
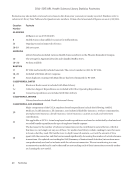
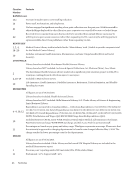
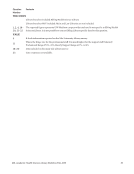
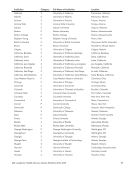
Summary Data
Summary
Mean
Median
High
Low
Sum
n
6,986
5,576
21,285
67
405,214
58
1,224,370
788,312
9,402,829
3,180
23,263,037
19
2,414,459
291,135
35,596,048
340
43,460,255
18
246,381
80,313
1,304,778
3,299
1,724,668
7
5,207
5,039
13,249
2
291,619
56
3,279
1,886
22,670
118
180,342
55
219,216
190,665
495,992
3,122
9,864,698
45
U
Initial
Circulations
17
Full-text article
requests
18
Regular
Searches
19
Federated
Searches
20
Total Items
Loaned (ILL)
21
Total Items
Borrowed (ILL)
22
Annual Gate
Count
23
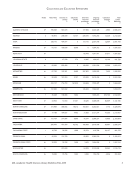
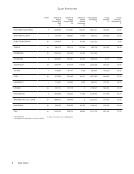
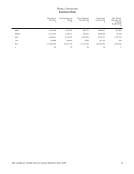
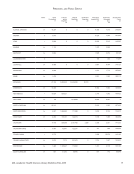
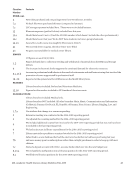
Personnel and Public Service
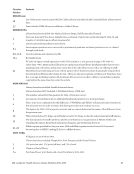
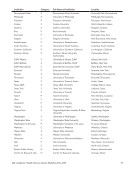
Summary Data
Summary
Mean
Median
High
Low
Sum
n
6,986
5,576
21,285
67
405,214
58
1,224,370
788,312
9,402,829
3,180
23,263,037
19
2,414,459
291,135
35,596,048
340
43,460,255
18
246,381
80,313
1,304,778
3,299
1,724,668
7
5,207
5,039
13,249
2
291,619
56
3,279
1,886
22,670
118
180,342
55
219,216
190,665
495,992
3,122
9,864,698
45
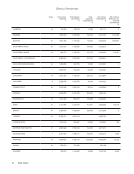
U
Initial
Circulations
17
Full-text article
requests
18
Regular
Searches
19
Federated
Searches
20
Total Items
Loaned (ILL)
21
Total Items
Borrowed (ILL)
22
Annual Gate
Count
23