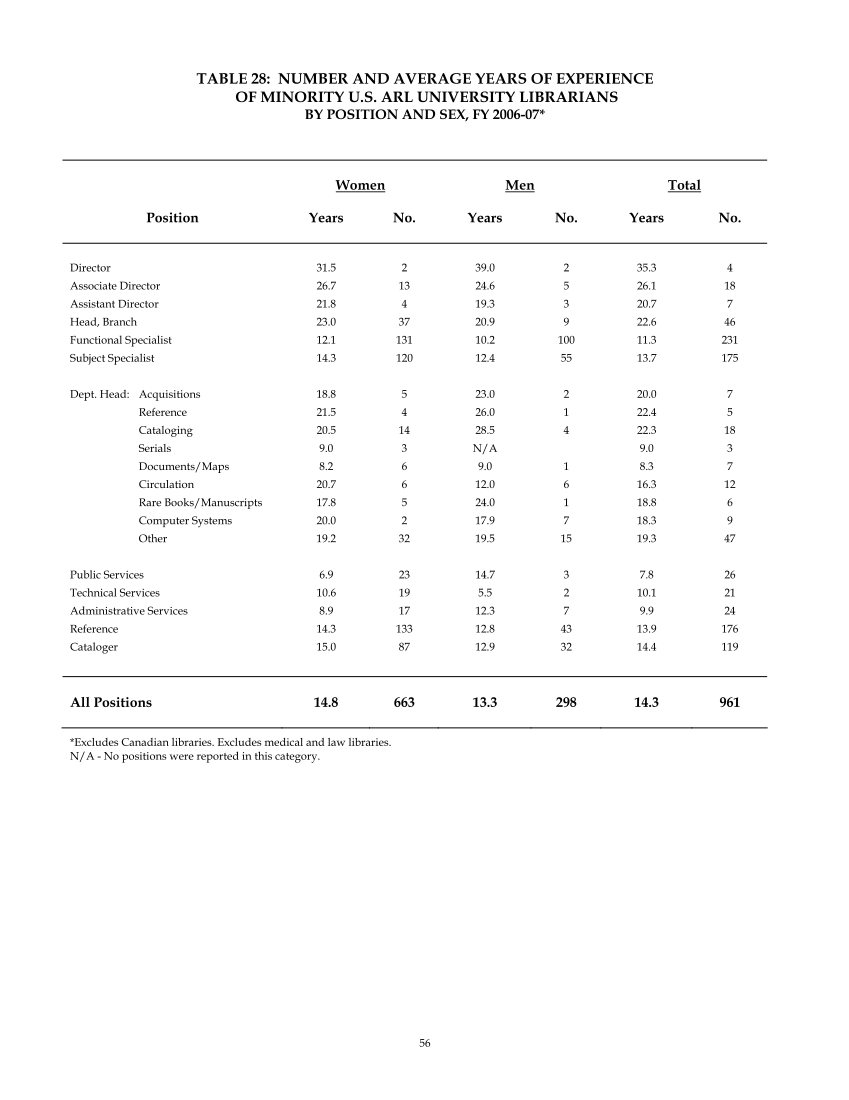
56 TABLE 28: NUMBER AND AVERAGE YEARS OF EXPERIENCE OF MINORITY U.S. ARL UNIVERSITY LIBRARIANS BY POSITION AND SEX, FY 2006-07* Women Men Total Position Years No. Years No. Years No. Director 31.5 2 39.0 2 35.3 4 Associate Director 26.7 13 24.6 5 26.1 18 Assistant Director 21.8 4 19.3 3 20.7 7 Head, Branch 23.0 37 20.9 9 22.6 46 Functional Specialist 12.1 131 10.2 100 11.3 231 Subject Specialist 14.3 120 12.4 55 13.7 175 Dept. Head: Acquisitions 18.8 5 23.0 2 20.0 7 Reference 21.5 4 26.0 1 22.4 5 Cataloging 20.5 14 28.5 4 22.3 18 Serials 9.0 3 N/A 9.0 3 Documents/Maps 8.2 6 9.0 1 8.3 7 Circulation 20.7 6 12.0 6 16.3 12 Rare Books/Manuscripts 17.8 5 24.0 1 18.8 6 Computer Systems 20.0 2 17.9 7 18.3 9 Other 19.2 32 19.5 15 19.3 47 Public Services 6.9 23 14.7 3 7.8 26 Technical Services 10.6 19 5.5 2 10.1 21 Administrative Services 8.9 17 12.3 7 9.9 24 Reference 14.3 133 12.8 43 13.9 176 Cataloger 15.0 87 12.9 32 14.4 119 All Positions 14.8 663 13.3 298 14.3 961 *Excludes Canadian libraries. Excludes medical and law libraries. N/A - No positions were reported in this category.
Help


