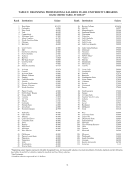
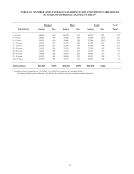
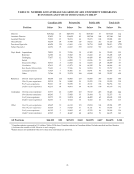
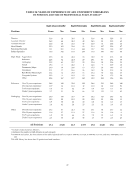
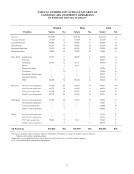
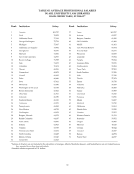
72 TABLE 40: NUMBER AND AVERAGE YEARS OF EXPERIENCE OF ARL UNIVERSITY MEDICAL LIBRARIANS BY POSITION AND SEX, FY 2006-07 Women Men Total Position Years No. Years No. Years No. Head, Medical 27.9 48 28.2 21 28.0 69 Associate Director 23.7 35 22.2 15 23.2 50 Assistant Director 19.5 35 16.0 6 19.0 41 Head, Branch 18.4 31 25.3 3 19.0 34 Functional Specialist 13.9 72 10.5 66 12.3 138 Subject Specialist 18.6 39 7.8 4 17.6 43 Dept. Head: Acquisitions 18.0 14 28.7 3 19.9 17 Reference 23.6 16 19.9 13 21.9 29 Cataloging 19.0 10 30.0 1 20.0 11 Serials 21.5 8 N/A 21.5 8 Documents/Maps 16.0 1 N/A 16.0 1 Circulation 16.1 7 9.4 8 12.5 15 Rare Books/Manuscripts 28.4 7 24.8 5 26.9 12 Computer Systems 12.4 10 16.9 9 14.5 19 Other 20.6 53 16.4 14 19.7 67 Public Services 13.8 33 14.3 8 13.9 41 Technical Services 14.3 16 26.8 6 17.7 22 Administrative Services 18.9 17 17.3 4 18.6 21 Reference 13.9 226 12.1 53 13.6 279 Cataloger 15.9 16 18.0 3 16.2 19 All Positions 17.4 694 15.8 242 17.0 936 N/A - No positions were reported in this category.
Help