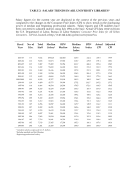
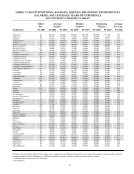
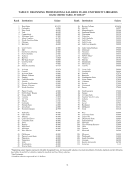
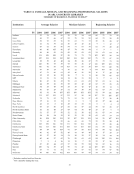
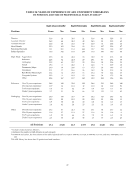
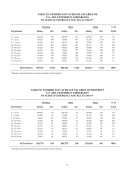
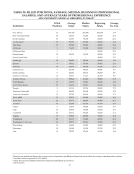
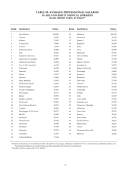
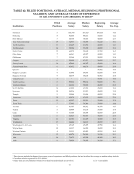
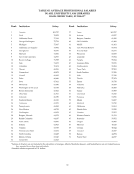
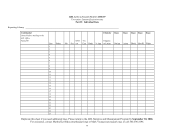
*Directors are included in figures for average years of experience and filled positions, but not in either the average or median salary statistics. † Canadian salaries expressed in U.S. dollars. ‡ Salary data are not published when fewer than four individuals are involved. § See Footnotes. 67 TABLE 35: FILLED POSITIONS AVERAGE, MEDIAN, BEGINNING PROFESSIONAL SALARIES AND AVERAGE YEARS OF PROFESSIONAL EXPERIENCE ARL UNIVERSITY MEDICAL LIBRARIES, FY 2006-07* Filled Average Median Beginning Average Institution Positions Salary Salary Salary Yrs. Exp. New Mexico 21 $74,350 $65,840 $36,750 17.4 New York University 24 66,214 65,264 45,000 15.3 North Carolina 30 61,507 58,000 40,000 20.1 Northwestern 15 53,383 49,206 40,000 14.2 Ohio State 15 53,549 55,081 40,500 18.6 Oklahoma 8 51,629 52,000 30,000 21.0 Oklahoma State 3 ‡ ‡ 40,000 25.3 Pennsylvania 13 58,129 53,952 42,000 15.2 Pennsylvania State 3 ‡ ‡ 40,000 15.7 Pittsburgh 29 54,402 50,828 40,000 13.8 Queen`s 9 56,321 55,601 38,452 12.3 Rochester 18 53,578 48,664 36,700 21.6 Saskatchewan 4 52,157 45,510 35,951 9.0 South Carolina 8 44,201 38,176 34,000 8.8 Southern California 14 69,281 71,417 44,300 18.7 Southern Illinois 6 57,544 61,026 35,000 21.5 SUNY Buffalo 17 55,379 55,887 45,000 15.8 SUNY Stony Brook 21 61,614 58,911 45,000 13.6 Temple 9 53,114 52,726 38,000 17.9 Tennessee, Knoxville 4 42,609 43,600 38,000 15.5 Tennessee, Memphis 13 52,102 48,186 40,000 17.7 Texas A&M 14 53,015 45,608 42,000 16.6 Texas Tech 21 47,971 44,430 38,388 21.7 Toronto § 19 74,269 82,710 41,878 16.9 Tulane 6 43,279 38,850 33,000 16.7 Utah 15 53,019 50,640 35,000 15.7 Vanderbilt 25 53,314 55,435 38,000 11.2 Virginia 15 58,806 60,850 45,000 16.8 Washington 20 60,133 55,248 40,000 21.0 Washington U.-St. Louis 23 58,717 47,813 39,500 23.3 Wayne State 11 46,550 43,983 45,000 20.1 Wisconsin 18 56,324 55,996 39,338 12.3 Yale 19 70,252 67,148 48,100 14.4
Help