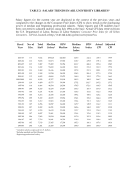
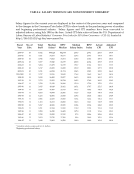
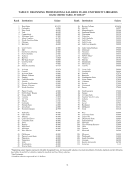
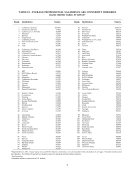
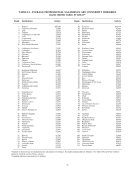
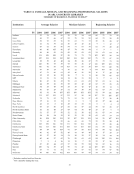
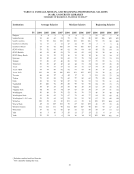
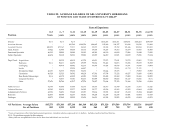
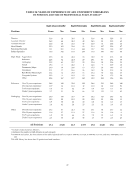
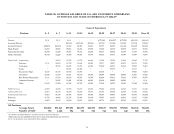
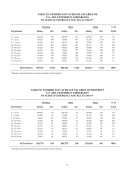
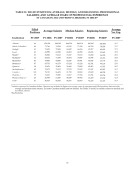
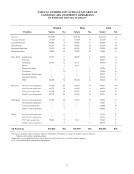
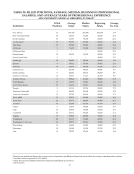
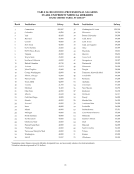
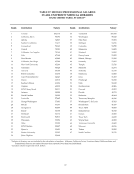
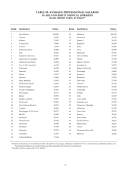
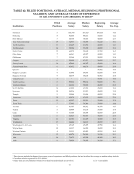
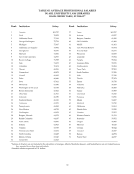
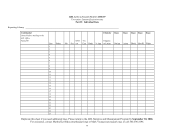
*Directors are included in figures for average years of experience and filled positions, but not in either the average or median salary statistics. Excludes medical and law libraries. See Tables 35 and 42 for statistics related to medical and law library salaries. † Canadian salaries expressed in U.S. dollars. ‡ See Footnotes. 29 TABLE 7: FILLED POSITIONS AVERAGE, MEDIAN, BEGINNING PROFESSIONAL SALARIES AND AVERAGE YEARS OF EXPERIENCE ARL UNIVERSITY LIBRARIES, FY 2006-07* Filled Pos. Average Salaries Median Salaries Beginning Salaries Average Yrs. Exp. Institution FY 2007 FY 2006 FY 2007 FY 2006 FY 2007 FY 2006 FY 2007 FY 2007 MIT 94 $65,006 $67,285 $62,100 $64,100 $44,000 $45,000 15.1 Miami ‡ 38 59,425 63,695 55,349 56,863 38,000 41,700 21.8 Michigan ‡ 114 63,448 64,295 57,527 59,920 40,000 40,000 18.2 Michigan State 64 60,069 62,101 57,800 59,700 43,000 47,000 16.0 Minnesota 107 62,872 64,164 59,776 61,033 36,000 38,000 19.0 Missouri ‡ 36 51,922 52,090 47,559 49,134 32,500 34,000 20.1 Montreal †‡ 87 50,998 56,909 50,583 54,360 33,241 34,504 15.6 Nebraska ‡ 49 56,297 58,792 49,357 52,928 40,500 40,500 17.4 New Mexico ‡ 33 68,175 70,749 66,598 71,319 40,000 40,000 20.1 New York ‡ 56 69,214 72,220 61,765 63,700 47,000 49,500 18.3 North Carolina 97 59,769 63,189 55,650 60,000 40,000 42,000 19.3 North Carolina State ‡ 77 60,293 66,529 54,174 59,500 45,000 46,000 11.9 Northwestern ‡ 81 61,459 62,941 58,397 60,144 36,000 37,000 16.6 Notre Dame ‡ 55 61,908 64,821 59,380 63,766 36,000 37,250 18.6 Ohio University ‡ 50 48,769 48,815 43,864 44,263 33,000 35,000 12.1 Ohio State ‡ 100 57,760 57,544 54,911 54,834 40,000 40,500 19.3 Oklahoma 42 50,372 49,386 47,210 46,162 40,000 40,000 12.4 Oklahoma State ‡ 56 51,414 53,406 47,376 49,536 34,000 36,000 16.3 Oregon ‡ 51 54,627 51,535 50,980 48,424 35,000 35,000 15.7 Pennsylvania ‡ 84 60,456 62,553 57,233 59,665 40,000 42,000 17.4 Pennsylvania State ‡ 134 62,619 64,546 59,436 61,308 39,000 40,000 18.7 Pittsburgh ‡ 61 59,357 61,695 55,414 56,345 30,000 34,000 16.4 Princeton ‡ 108 71,845 70,082 67,300 64,600 40,000 40,000 20.2 Purdue ‡ 69 60,839 61,429 55,535 54,330 42,000 43,000 16.5 Queen’s † ‡ 34 61,355 67,488 61,342 68,700 34,738 38,452 18.7 Rice 58 57,524 58,302 51,100 51,600 34,527 36,099 14.9 Rochester ‡ 71 51,184 53,255 48,339 49,733 36,000 36,700 15.2 Rutgers ‡ 91 71,747 77,298 73,488 80,048 44,523 44,525 19.7 Saskatchewan † ‡ 40 58,792 64,936 56,183 64,350 33,453 35,951 16.7 South Carolina ‡ 55 50,948 51,060 46,427 47,388 34,000 34,000 15.9 Southern California ‡ 90 73,042 68,457 63,100 62,900 45,000 45,000 17.9 Southern Illinois ‡ 37 54,339 53,791 46,735 47,311 39,000 39,500 13.5 SUNY Albany ‡ 58 56,556 58,663 55,285 56,376 37,500 38,500 18.9 SUNY Buffalo ‡ 104 56,563 58,519 52,913 53,790 38,753 45,000 14.0 SUNY Stony Brook 31 64,731 68,185 62,387 65,764 41,000 42,000 20.0 Syracuse 44 59,142 62,119 53,675 55,757 36,000 U/A 20.2 Temple ‡ 37 58,513 63,282 52,688 58,670 36,500 38,000 18.8 Tennessee 47 60,843 63,432 56,564 62,319 40,000 40,000 15.9 Texas ‡ 127 59,768 62,185 54,736 56,619 40,000 44,000 16.9 Texas A&M 87 55,163 56,327 49,950 50,502 40,000 42,000 14.6 Texas Tech ‡ 57 51,426 51,858 46,973 47,410 38,000 38,000 11.2 Toronto † ‡ 142 63,296 74,374 65,454 77,290 36,649 41,878 16.7 Tulane 27 55,000 59,287 53,120 58,294 34,000 37,000 20.2 Utah 55 53,434 56,452 49,117 51,633 38,000 40,000 19.3 Vanderbilt ‡ 58 54,619 56,839 50,131 51,264 36,000 38,000 17.8 Virginia ‡ 68 61,920 64,777 60,050 61,800 40,000 41,800 16.9 Virginia Tech 33 57,304 59,256 55,968 56,150 38,000 37,000 17.7 Washington ‡ 117 59,273 60,054 54,798 55,656 38,800 40,000 18.2 Washington State ‡ 43 59,010 58,761 57,647 55,343 37,000 37,500 17.3 Washington U.-St.Louis ‡ 51 58,839 57,999 50,863 51,648 37,000 37,000 17.9 Waterloo † ‡ 35 58,147 65,337 59,827 67,035 33,491 39,328 20.4 Wayne State ‡ 92 50,166 52,524 44,598 46,387 36,000 40,000 12.7 Western Ontario † ‡ 68 48,647 54,221 46,456 49,869 37,185 40,958 14.7 Wisconsin ‡ 142 57,610 60,691 55,391 58,640 37,719 39,338 17.1 Yale 206 68,596 74,753 61,096 68,987 40,400 48,100 18.2 York † ‡ 51 69,150 73,646 64,312 69,450 33,788 36,310 17.7
Help