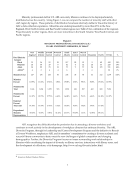
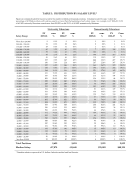
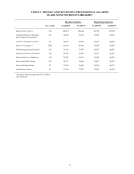
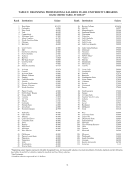
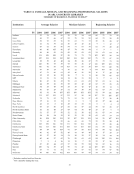
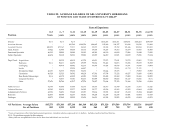
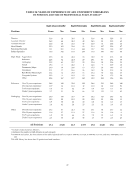
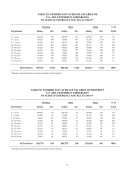
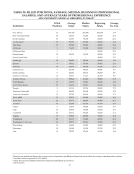
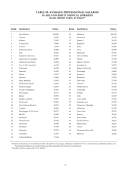
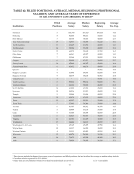
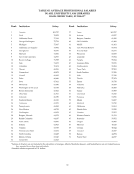
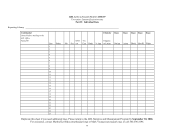
18 TABLE 1: DISTRIBUTION BY SALARY LEVEL* Figures in columns headed by fiscal year show the number of filled professional positions. Columns headed by cum. % show the percentage of all filled positions with salaries equal to or more than the beginning of each salary range. For example, in FY 2006-07, 74.2% of all ARL university librarians earned more than $50,000, as did 93.8% of all ARL nonuniversity librarians. University Librarians Nonuniversity Librarians FY cum. FY cum. FY cum. FY Cum. Salary Range 2005-06 % 2006-07 % 2005-06 % 2006-07 % More than 250,000 9 0.1% 9 0.1% 1 0.0% 1 0.0% 200,000 ‐ 250,000 21 0.3% 28 0.4% 0 0.0% 1 0.1% 175,000 ‐ 199,999 29 0.6% 31 0.7% 1 0.1% 2 0.1% 150,000 ‐ 174,999 60 1.2% 60 1.3% 7 0.2% 106 2.9% 140,000 ‐ 149,999 39 1.6% 41 1.7% 102 2.8% 8 3.1% 130,000 ‐ 139,999 45 2.1% 47 2.2% 190 7.7% 215 8.7% 120,000 ‐ 129,999 45 2.6% 68 2.9% 110 10.5% 107 11.5% 110,000 ‐ 119,999 103 3.6% 143 4.3% 222 16.1% 277 18.7% 100,000 ‐ 109,999 186 5.6% 224 6.6% 247 22.4% 367 28.3% 95,000 ‐ 99,999 127 6.9% 146 8.1% 165 26.7% 179 33.0% 90,000 ‐ 94,999 183 8.8% 251 10.7% 190 31.5% 256 39.6% 85,000 ‐ 89,999 244 11.3% 316 13.9% 251 37.9% 185 44.5% 80,000 ‐ 84,999 381 15.2% 436 18.3% 343 46.6% 307 52.5% 76,000 ‐ 79,999 347 18.8% 429 22.7% 213 52.1% 194 57.5% 74,000 ‐ 75,999 209 21.0% 219 24.9% 136 55.5% 84 59.7% 72,000 ‐ 73,999 229 23.4% 240 27.4% 72 57.4% 134 63.2% 70,000 ‐ 71,999 287 26.3% 289 30.3% 76 59.3% 147 67.1% 68,000 ‐ 69,999 253 29.0% 308 33.4% 183 64.0% 129 70.4% 66,000 ‐ 67,999 304 32.1% 341 36.9% 81 66.1% 127 73.7% 64,000 ‐ 65,999 361 35.9% 398 41.0% 136 69.5% 129 77.1% 62,000 ‐ 63,999 343 39.4% 395 45.0% 120 72.6% 130 80.5% 60,000 ‐ 61,999 413 43.7% 432 49.4% 37 73.5% 69 82.3% 58,000 ‐ 59,999 401 47.8% 421 53.7% 99 76.1% 90 84.7% 56,000 ‐ 57,999 494 53.0% 475 58.5% 110 78.9% 148 88.5% 54,000 ‐ 55,999 478 57.9% 508 63.7% 144 82.5% 101 91.2% 52,000 ‐ 53,999 526 63.4% 515 68.9% 153 86.4% 38 92.1% 50,000 ‐ 51,999 538 68.9% 519 74.2% 44 87.6% 63 93.8% 48,000 ‐ 49,999 511 74.2% 494 79.2% 109 90.3% 37 94.8% 46,000 ‐ 47,999 505 79.5% 508 84.4% 68 92.1% 52 96.1% 44,000 ‐ 45,999 510 84.7% 397 88.4% 134 95.5% 73 98.0% 42,000 ‐ 43,999 448 89.4% 360 92.1% 95 97.9% 31 98.8% 40,000 ‐ 41,999 387 93.4% 292 95.1% 29 98.6% 6 99.0% 38,000 ‐ 39,999 231 95.8% 194 97.0% 18 99.1% 10 99.2% 36,000 ‐ 37,999 191 97.8% 146 98.5% 15 99.5% 10 99.5% 34,000 ‐ 35,999 122 99.0% 73 99.3% 12 99.8% 8 99.7% 32,000 ‐ 33,999 56 99.6% 32 99.6% 3 99.9% 9 99.9% 30,000 ‐ 31,999 20 99.8% 19 99.8% 1 99.9% 1 100.0% less than 30,000 19 100.0% 20 100.0% 4 100.0% 1 100.0% Total Positions 9,655 9,824 3,921 3,832 Median Salary $57,074 $59,648 $76,083 $80,124 * Canadian salaries expressed in U.S. dollars. Includes medical and law libraries.
Help