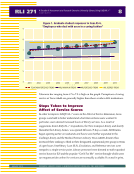
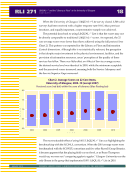
When the University of Glasgow LibQUAL+® Lite survey closed, 2,508 valid surveys had been received with a higher response rate (9.8%) than previous iterations, and equally important, a representative sample was achieved. The potential drawback to using LibQUAL+® Lite is that the scores may not be directly comparable to traditional LibQUAL+® scores. As expected, the 22 core average scores were lower than those achieved using the full protocol (see Chart 2). This pattern was repeated for the Library as Place and Information Control dimensions. Although this is not statistically relevant, the perception is that despite major investment in the physical environment, facilities, and the provision of information resources, users’ perception of the quality of these services has fallen. There was little effect on Affect of Service average scores the desired service level was identical to 2009, while the minimum acceptable and the perceived scores increased, meaning both the Service Adequacy and the Service Superior Gaps narrowed. [KEVIN: PLEASE PLACE CHART 2 IN THIS VICINITY.] The most noticeable effect of using 100% LibQUAL+® Lite was highlighting the benchmarking with the SCONUL consortium. When the 2010 average scores were benchmarked with the SCONUL consortium and five other Russell Group libraries, it became apparent that the playing field was not level, or as Bruce Thompson would say, we were not “comparing apples to apples.” Glasgow University was the only library in the group that implemented 100% LibQUAL+® Lite in 2010. RLI 271 18 LibQUAL+® and the “Library as Place” at the University of Glasgow ( C O N T I N U E D ) AUGUST 2010 RESEARCH LIBRARY ISSUES: A BIMONTHLY REPORT FROM ARL, CNI, AND SPARC 2003 2004 2005 2006 2008 2009 2010 8.0 7.5 7.0 6.5 6.0 Y E A R Chart 2. Average Scores on 22 Core Items, University of Glasgow, 2003–10 (except 2007) Perceived score (red dot) within the zone of tolerance (blue floating bar) M E A N
Help