60 · Survey Results: Survey Questions and Responses
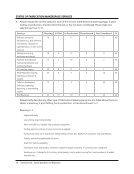
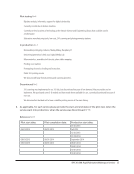
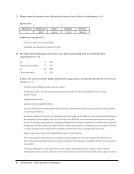
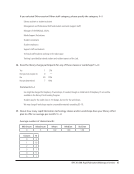
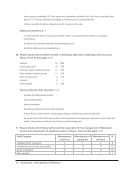
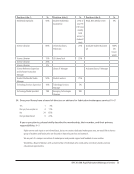
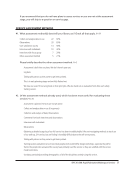
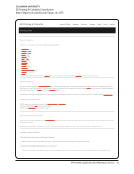
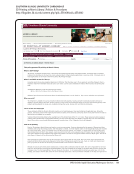
46. If you gather data on the number of service users, please give your best estimate of the number of
the users for the current fiscal year. N=18
Minimum Maximum Mean Median Std Dev
15 1970 485.39 179.00 620.00
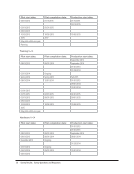
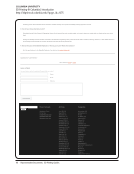
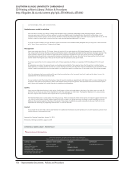
47. During what period of the year is your makerspace the busiest? N=18
Assessment is planned. Service not yet offered.
Beginning of each semester
During mid-terms and finals week
Early part of the semester
End of the semesters (November and April). Then number of users next year will increase dramatically with the new
workshop focused Makerspace.
Fall (October–November)
Fall and Winter terms: midpoint of term is the busiest
Last month of the semester(s)
March–May
Near end of each term
November/December
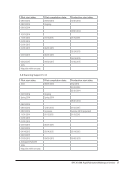
Our services are near capacity so we do not see much fluctuation in utilization throughout the year, however, emphasis
and urgency changes. For example, common deadlines for students (mid-terms, finals) translate into different
submissions than the summer, which are typically more research oriented.
Spring and fall semesters
Three weeks before finals
Too soon to tell right now, but seems like it corresponds to class project due dates.
Towards the end of the semester as students are finishing up projects.
We are not sure yet.
We do not know yet.
We’ve only been around since October 2014. It’s been steady since then.
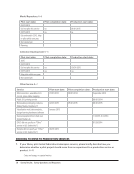
SERVICE ASSESSMENT: INTERVIEWS AND SURVEYS
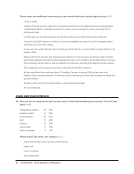
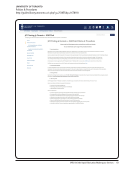
48. If you have interviewed or surveyed users, what aspects of makerspaces and fabrication
technologies are of the greatest interest to them? N=11
3-D printing
Access and speed of services is very important. Pricing is also very important.
46. If you gather data on the number of service users, please give your best estimate of the number of
the users for the current fiscal year. N=18
Minimum Maximum Mean Median Std Dev
15 1970 485.39 179.00 620.00
47. During what period of the year is your makerspace the busiest? N=18
Assessment is planned. Service not yet offered.
Beginning of each semester
During mid-terms and finals week
Early part of the semester
End of the semesters (November and April). Then number of users next year will increase dramatically with the new
workshop focused Makerspace.
Fall (October–November)
Fall and Winter terms: midpoint of term is the busiest
Last month of the semester(s)
March–May
Near end of each term
November/December
Our services are near capacity so we do not see much fluctuation in utilization throughout the year, however, emphasis
and urgency changes. For example, common deadlines for students (mid-terms, finals) translate into different
submissions than the summer, which are typically more research oriented.
Spring and fall semesters
Three weeks before finals
Too soon to tell right now, but seems like it corresponds to class project due dates.
Towards the end of the semester as students are finishing up projects.
We are not sure yet.
We do not know yet.
We’ve only been around since October 2014. It’s been steady since then.
SERVICE ASSESSMENT: INTERVIEWS AND SURVEYS
48. If you have interviewed or surveyed users, what aspects of makerspaces and fabrication
technologies are of the greatest interest to them? N=11
3-D printing
Access and speed of services is very important. Pricing is also very important.