SPEC Kit 348: Rapid Fabrication/Makerspace Services · 59
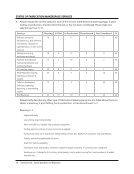
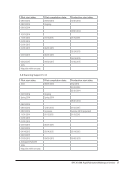
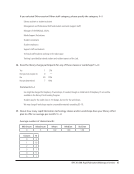
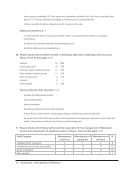
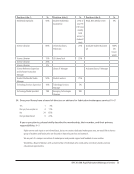
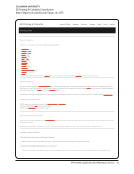
Number of website visits 13 54%
Number of participants at user outreach events 12 50%
Number of total 3-D scans 12 50%
Number of consultations 12 50%
Retention of models developed or printed 6 25%
Other data 7 29%
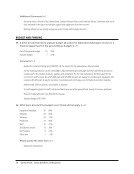
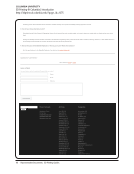
Please specify the other assessment data. N=7
Costs, revenue, and comparison with competition
How often particular software is used.
Log book has information about each print job.
Money spent on filament and other supplies.
Number of curricular applications as reported by users.
Print jobs broken down by type (personal projects vs. research oriented jobs), department of user, university status
(undergrad, grad, staff, faculty)
Type of service user (which department, status of user)
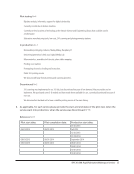
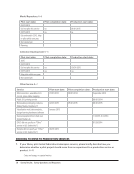
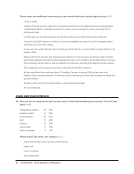
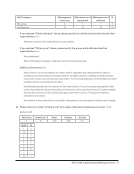
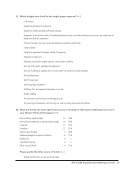
45. Which type(s) of data has been most useful for evaluating these services? N=16
#of total prints
Assessment is planned. Service not yet offered.
Data on print jobs and workshop evaluation forms
Demographic data
Number and type of prints number of reference/project planning requests
Number and type of service user (which department, status of user)
Number of 3-D prints
Number of service users (3 responses)
Number of service users, number of workshop attendees
Number of service users and engagement with our users (consultations, workshops, etc.) have proved to be helpful in
identifying areas of improvement and evaluating the services’ effectiveness. We also found that actively going to local
maker events identifies who is not using our services and gives us an opportunity to understand why.
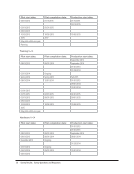
Number of total prints, curricular demand
The number of 3-D prints and workshop attendees
Type of 3-D printing (what type of machine used)
Unknown, too early
Number of website visits 13 54%
Number of participants at user outreach events 12 50%
Number of total 3-D scans 12 50%
Number of consultations 12 50%
Retention of models developed or printed 6 25%
Other data 7 29%
Please specify the other assessment data. N=7
Costs, revenue, and comparison with competition
How often particular software is used.
Log book has information about each print job.
Money spent on filament and other supplies.
Number of curricular applications as reported by users.
Print jobs broken down by type (personal projects vs. research oriented jobs), department of user, university status
(undergrad, grad, staff, faculty)
Type of service user (which department, status of user)
45. Which type(s) of data has been most useful for evaluating these services? N=16
#of total prints
Assessment is planned. Service not yet offered.
Data on print jobs and workshop evaluation forms
Demographic data
Number and type of prints number of reference/project planning requests
Number and type of service user (which department, status of user)
Number of 3-D prints
Number of service users (3 responses)
Number of service users, number of workshop attendees
Number of service users and engagement with our users (consultations, workshops, etc.) have proved to be helpful in
identifying areas of improvement and evaluating the services’ effectiveness. We also found that actively going to local
maker events identifies who is not using our services and gives us an opportunity to understand why.
Number of total prints, curricular demand
The number of 3-D prints and workshop attendees
Type of 3-D printing (what type of machine used)
Unknown, too early