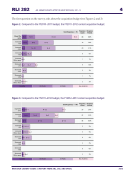
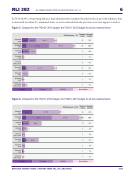
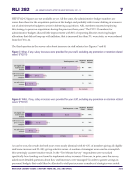
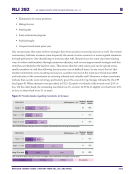
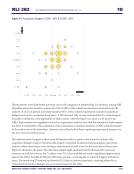
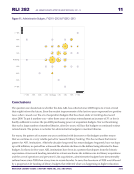
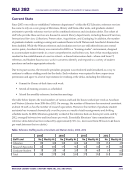
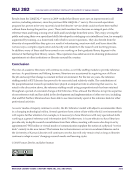
RLI 282 ARL Library Budgets after the Great Recession, 2011–13 7 RESEARCH LIBRARY ISSUES: A REPORT FROM ARL, CNI, AND SPARC 2013 HEPI FY12–13 figures are not available as yet. All the same, the administrative budget numbers are worse than those for the acquisition portion of the budget and probably reflect some shifting of resources out of administrative budgets to assist in bolstering acquisitions. ARL members reported employing this strategy to preserve acquisitions during the previous three years.8 The FY12–13 numbers for administrative budgets showed little improvement with 81% of reporting libraries receiving budget allocations that did not keep up with inflation, that is increased less than 3%, were static, or were reduced from the FY11–12. The third question in the survey asks about increases in staff salaries (see Figures 7 and 8). Figure 7. What, if any, salary increases were provided for your staff, excluding any promotion or retention related raises? (FY2011) Figure 8. What, if any, salary increases were provided for your staff, excluding any promotion or retention related raises? (FY2012) As can be seen, the results for both years were nearly identical with 61–63% of members giving all eligible staff some increase and 23–24% giving selective raises. A number of strategies were used to accomplish this seemingly counter-intuitive result. In the “Ten-Minute Survey” respondents were not asked specifically how funding was found to implement salary increases. However, in prior years the survey asked more detailed questions about how staff increases were managed.9 In order to garner savings in personnel budgets that could then be allocated to staff pay increases a number of strategies were noted: Total Responses = 95 Response Count Response Percent All eligible staff received some increase 60 63% Staff increases were given to selective categories 22 23% No staff received increases 13 14% N=6 N=22 N=29 N=3 N=4 N=1 N=15 N=2 N=1 N=11 N=1 Canadian US Private US Public Non Academic Total Responses = 100 Response Count Response Percent All eligible staff received some increase 61 61% Staff increases were given to selective categories 24 24% No staff received increases 15 15% N=8 N=22 N=30 N=1 N=5 N=2 N=16 N=12 N=3 N=1 Canadian US Private US Public Non Academic
Help