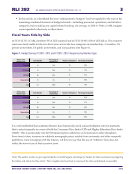
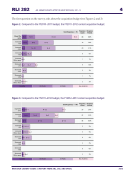
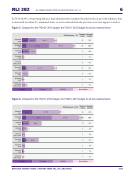
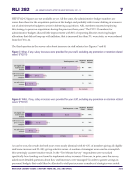
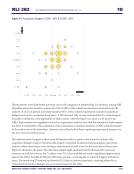
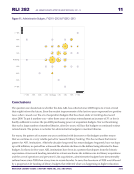
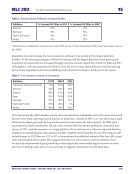
RLI 282 ARL Library Budgets after the Great Recession, 2011–13 4 RESEARCH LIBRARY ISSUES: A REPORT FROM ARL, CNI, AND SPARC 2013 The first question on the survey asks about the acquisition budget (see Figures 2 and 3). Figure 2. Compared to the FY2010–2011 budget, the FY2011–2012 content acquisition budget: Figure 3. Compared to the FY2011–2012 budget, the FY2012–2013 content acquisition budget: Total Responses = 95 Response Count Response Percent Stayed the same 34 36% Increased 1-3% 19 20% Increased 4-6% 20 21% Increased 7-9% 6 6% Increased 10% or more 1 1% Decreased 1-3% 9 10% Decreased 4-6% 3 3% Decreased 7-9% 1 1% Decreased 10% or more 2 2% N=3 N=5 N=22 N=4 N=6 N=9 N=2 N=10 N=8 N=1 N=2 N=3 N=1 N=1 N=1 N=1 N=3 N=4 N=1 N=7 N=1 Canadian US Private US Public Non Academic Total Responses = 100 Response Count Response Percent Stayed the same 26 26% Increased 1-3% 22 22% Increased 4-6% 32 32% Increased 7-9% 5 5% Increased 10% or more 5 5% Decreased 1-3% 6 6% Decreased 4-6% 2 2% Decreased 7-9% 0 0% Decreased 10% or more 2 2% N=2 N=1 N=22 N=5 N=6 N=9 N=16 N=13 N=1 N=4 N=5 N=1 N=1 N=1 N=2 N=2 N=1 N=3 N=3 N=1 N=1 Canadian US Private US Public Non Academic
Help