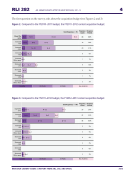
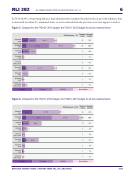
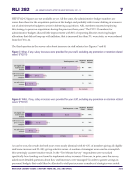
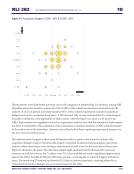
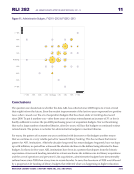
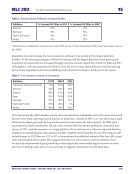
RLI 282 ARL Library Budgets after the Great Recession, 2011–13 6 RESEARCH LIBRARY ISSUES: A REPORT FROM ARL, CNI, AND SPARC 2013 In FY11–12 89% of reporting libraries had administrative budgets that did not keep up with inflation, that is increased less than 3%, remained static, or were reduced from the previous year (see Figures 5 and 6). Figure 5. Compared to the FY2010–2011 budget, the FY2011–2012 budget for all non-material items: Figure 6. Compared to the FY2011–2012 budget, the FY2012–2013 budget for all non-material items: Total Responses = 95 Response Count Response Percent Stayed the same 22 23% Increased 1-3% 33 35% Increased 4-6% 9 10% Increased 7-9% 1 1% Increased 10% or more 0 0% Decreased 1-3% 22 23% Decreased 4-6% 4 4% Decreased 7-9% 1 1% Decreased 10% or more 3 3% N=4 N=5 N=11 N=3 N=14 N=15 N=1 N=4 N=4 N=1 N=2 N=1 N=1 N=2 N=4 N=17 N=2 N=1 N=2 N=1 Canadian US Private US Public Non Academic Total Responses = 100 Response Count Response Percent Stayed the same 26 26% Increased 1-3% 40 40% Increased 4-6% 13 13% Increased 7-9% 4 4% Increased 10% or more 2 2% Decreased 1-3% 11 11% Decreased 4-6% 2 2% Decreased 7-9% 1 1% Decreased 10% or more 1 1% N=7 N=18 N=3 N=17 N=18 N=4 N=8 N=1 N=1 N=1 N=8 N=2 N=1 N=1 N=2 N=1 N=2 N=1 N=2 N=2 Canadian US Private US Public Non Academic
Help