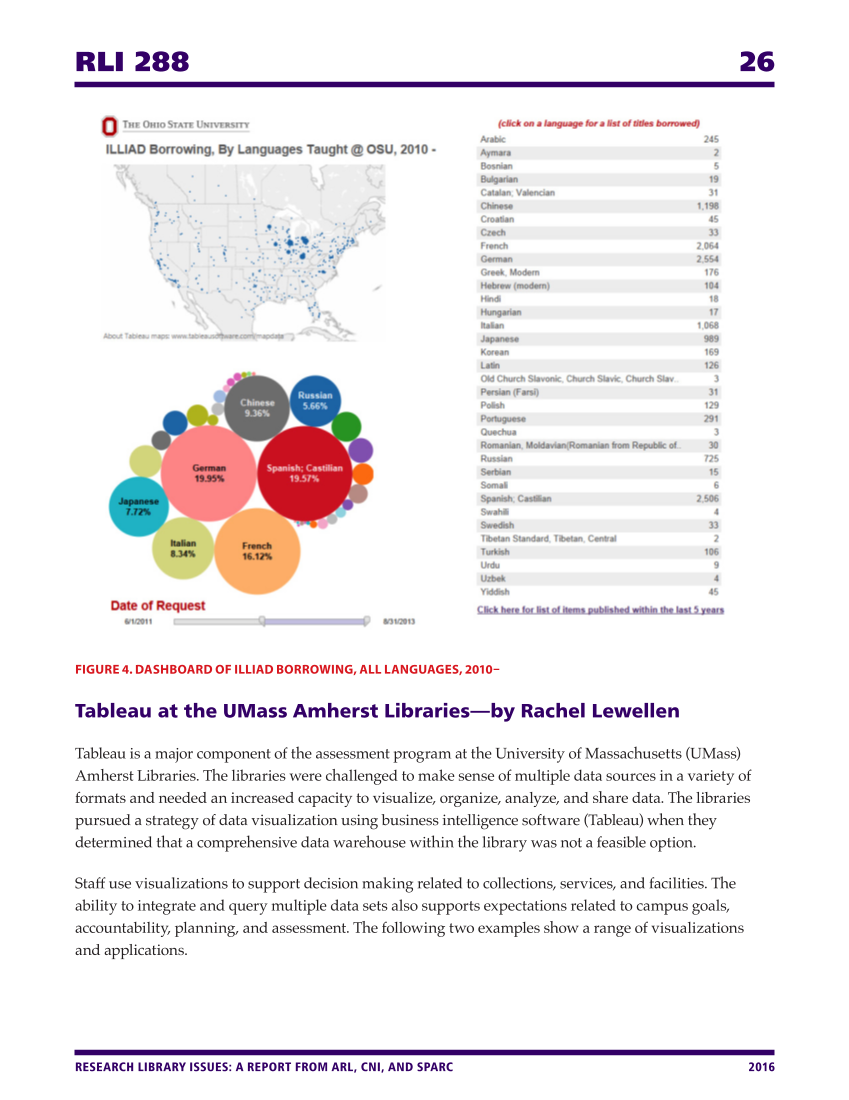
RLI 288 26 RESEARCH LIBRARY ISSUES: A REPORT FROM ARL, CNI, AND SPARC 2016 FIGURE 4. DASHBOARD OF ILLIAD BORROWING, ALL LANGUAGES, 2010– Tableau at the UMass Amherst Libraries—by Rachel Lewellen Tableau is a major component of the assessment program at the University of Massachusetts (UMass) Amherst Libraries. The libraries were challenged to make sense of multiple data sources in a variety of formats and needed an increased capacity to visualize, organize, analyze, and share data. The libraries pursued a strategy of data visualization using business intelligence software (Tableau) when they determined that a comprehensive data warehouse within the library was not a feasible option. Staff use visualizations to support decision making related to collections, services, and facilities. The ability to integrate and query multiple data sets also supports expectations related to campus goals, accountability, planning, and assessment. The following two examples show a range of visualizations and applications.
Help


