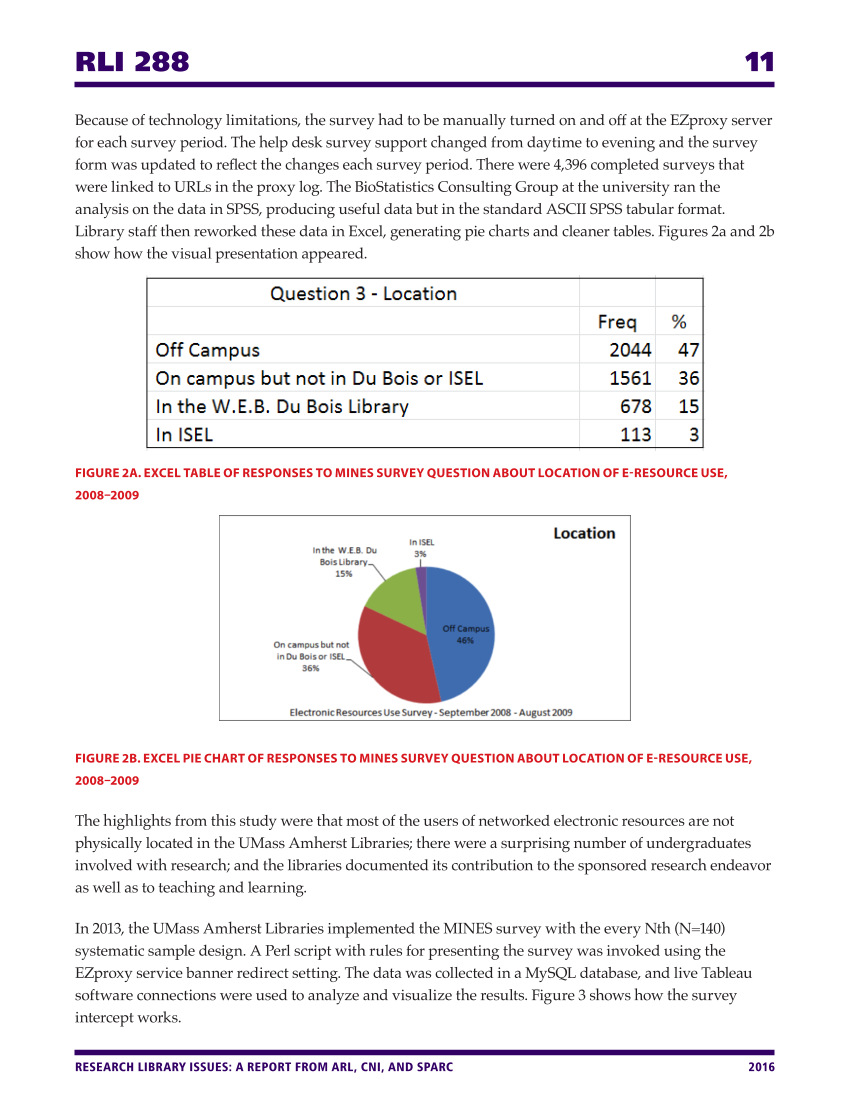
RLI 288 11 RESEARCH LIBRARY ISSUES: A REPORT FROM ARL, CNI, AND SPARC 2016 Because of technology limitations, the survey had to be manually turned on and off at the EZproxy server for each survey period. The help desk survey support changed from daytime to evening and the survey form was updated to reflect the changes each survey period. There were 4,396 completed surveys that were linked to URLs in the proxy log. The BioStatistics Consulting Group at the university ran the analysis on the data in SPSS, producing useful data but in the standard ASCII SPSS tabular format. Library staff then reworked these data in Excel, generating pie charts and cleaner tables. Figures 2a and 2b show how the visual presentation appeared. FIGURE 2A. EXCEL TABLE OF RESPONSES TO MINES SURVEY QUESTION ABOUT LOCATION OF E-RESOURCE USE, 2008–2009 FIGURE 2B. EXCEL PIE CHART OF RESPONSES TO MINES SURVEY QUESTION ABOUT LOCATION OF E-RESOURCE USE, 2008–2009 The highlights from this study were that most of the users of networked electronic resources are not physically located in the UMass Amherst Libraries there were a surprising number of undergraduates involved with research and the libraries documented its contribution to the sponsored research endeavor as well as to teaching and learning. In 2013, the UMass Amherst Libraries implemented the MINES survey with the every Nth (N=140) systematic sample design. A Perl script with rules for presenting the survey was invoked using the EZproxy service banner redirect setting. The data was collected in a MySQL database, and live Tableau software connections were used to analyze and visualize the results. Figure 3 shows how the survey intercept works.
Help


