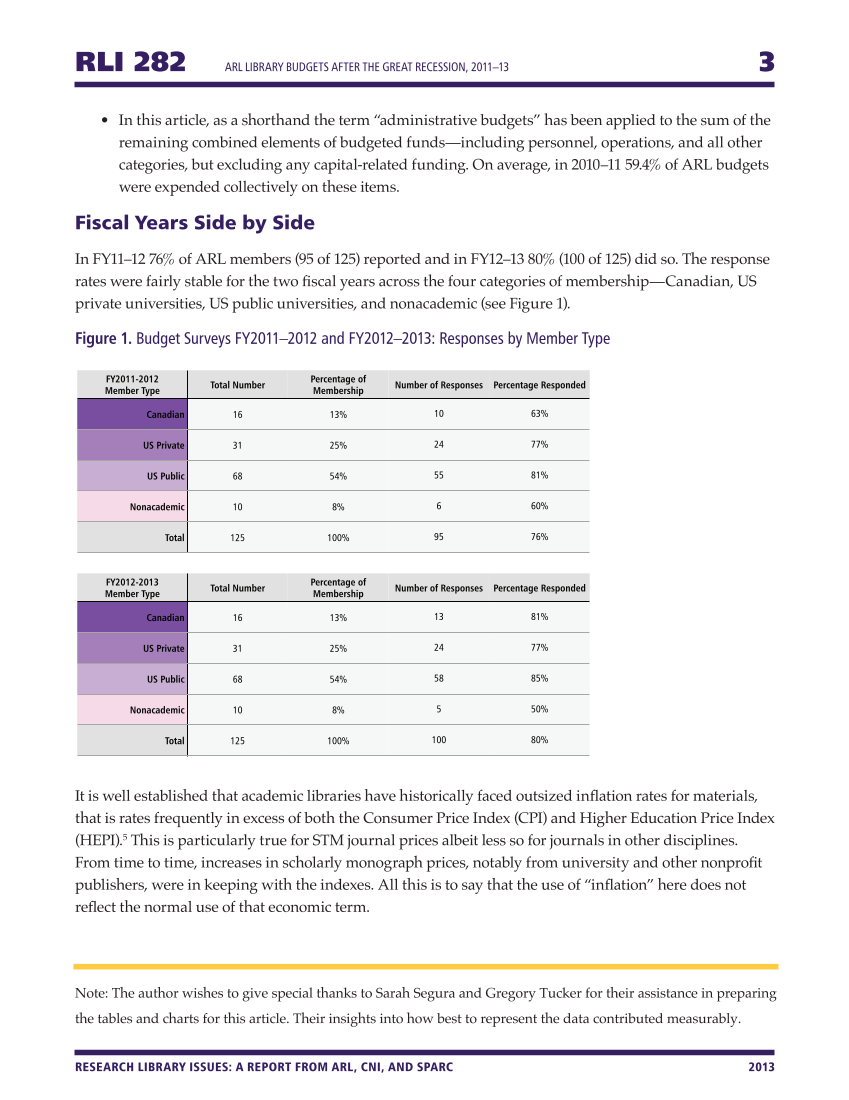
RLI 282 ARL Library Budgets after the Great Recession, 2011–13 3 RESEARCH LIBRARY ISSUES: A REPORT FROM ARL, CNI, AND SPARC 2013 • In this article, as a shorthand the term “administrative budgets” has been applied to the sum of the remaining combined elements of budgeted funds—including personnel, operations, and all other categories, but excluding any capital-related funding. On average, in 2010–11 59.4% of ARL budgets were expended collectively on these items. Fiscal Years Side by Side In FY11–12 76% of ARL members (95 of 125) reported and in FY12–13 80% (100 of 125) did so. The response rates were fairly stable for the two fiscal years across the four categories of membership—Canadian, US private universities, US public universities, and nonacademic (see Figure 1). Figure 1. Budget Surveys FY2011–2012 and FY2012–2013: Responses by Member Type It is well established that academic libraries have historically faced outsized inflation rates for materials, that is rates frequently in excess of both the Consumer Price Index (CPI) and Higher Education Price Index (HEPI).5 This is particularly true for STM journal prices albeit less so for journals in other disciplines. From time to time, increases in scholarly monograph prices, notably from university and other nonprofit publishers, were in keeping with the indexes. All this is to say that the use of “inflation” here does not reflect the normal use of that economic term. Note: The author wishes to give special thanks to Sarah Segura and Gregory Tucker for their assistance in preparing the tables and charts for this article. Their insights into how best to represent the data contributed measurably. FY2012-2013 Member Type Total Number Percentage of Membership Number of Responses Percentage Responded Canadian 16 13% 13 81% US Private 31 25% 24 77% US Public 68 54% 58 85% Nonacademic 10 8% 5 50% Total 125 100% 100 80% FY2011-2012 Member Type Total Number Percentage of Membership Number of Responses Percentage Responded Canadian 16 13% 10 63% US Private 31 25% 24 77% US Public 68 54% 55 81% Nonacademic 10 8% 6 60% Total 125 100% 95 76%
Help


